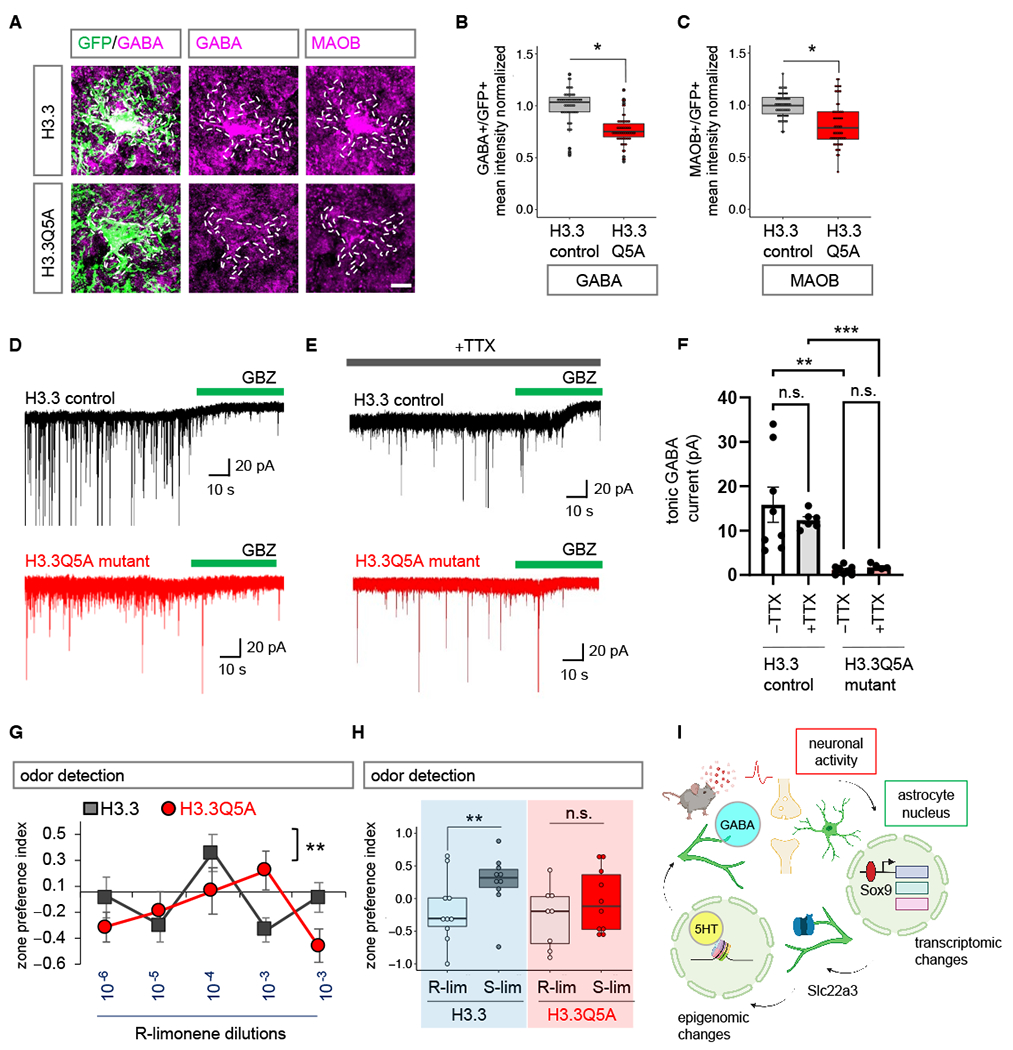
Fig. 8. Inhibition of H3-5HT disrupts astrocytic tonic GABA release and sensory processing.

(A-C) Immunostaining and box plots depicting quantification of astrocytic GABA and MAOB in H3.3 and H3.3Q5A OBs (56-58 cells/cohort, GABA: *p= 0.0117, unpaired two-tailed Student’s t-test on n= 4 mice/cohort; MAOB *p= 0.0285, Wilcoxon rank sum test on n= 4 mice/cohort). Scale bar: 10 µm. (D-E) Traces of tonic GABA currents in granule cells in OBs from H3.3 and H3.3Q5A treated with gabazine (GBZ, 20 μM), with or without TTX (0.5 μM). (F) Quantification of tonic GABA currents (5-8 cells/cohort, –TTX **p= 0.0017, +TTX ***p= 0.0007; unpaired two-tailed Student’s t-test on n= 3 mice/cohort). Data presented as mean ± SEM. (G) Quantification of odor detection in H3.3 and H3.3Q5A mice (n=10/cohort, **p= 0.0072; two-way repeated measures ANOVA with Sidak multiple comparison). (H) Quantification of odor discrimination between R-lim and S-lim from the same cohorts of mice (n=10/cohort, **p= 0.0058; two-way repeated measures ANOVA with Sidak multiple comparisons). See Table S3 for data summary. (I) Model figure integrating activity dependent transcriptional changes in astrocytes, with Slc22a3 function in olfactory circuits, and histone serotonylation regulation of GABA in astrocytes.
