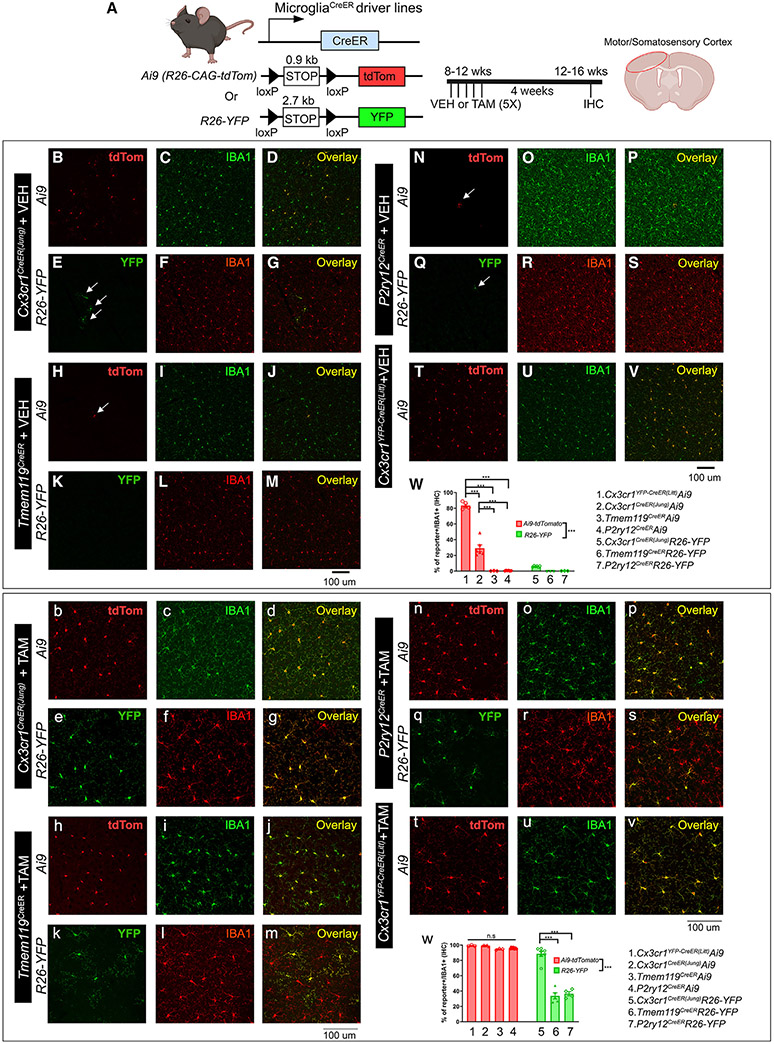
Figure 1. Evaluation of the TAM-independent leakiness and the efficiency of TAM-dependent Cre recombination in the four different CreER driver lines using either the Ai9-tdTomato or R26-YFP reporter mouse lines.
The experimental timeline is shown in (A). Representative images from each Cre driver and reporter line are shown (B–V for vehicle [VEH] treatment and b–v for TAM treatment). The Cre driver and the reporter line are indicated on the left. Quantification of reporter+ cells in the IBA1+ populations in the brain is shown in (W) (for VEH treatment) and (w) (for TAM treatment). Representative images are taken from the cortical region, which reflects the general and homogenous trend in the whole parenchyma. Each data point represents the average of 1 animal (the average for each animal is obtained by quantifying multiple brain sections at similar anatomical locations), and the average for each animal was used as a single data point for statistical analysis. Mean ± SEM. **p < 0.01, ***p < 0.001, two-way ANOVA, Tukey post hoc pairwise analysis. Ai9 vs. R26-YFP is significantly different as a factor (p < 0.001). Data were combined from 2 independent cohorts of mice. Scale bars, 100 μm. Compared with the two Cx3cr1CreER lines (Littman and Jung), Tmem119CreER and P2ry12CreER show less leakiness in the absence of TAM but a decreased recombination efficiency and mosaic recombination in microglia. See also Figures S1-S4.

