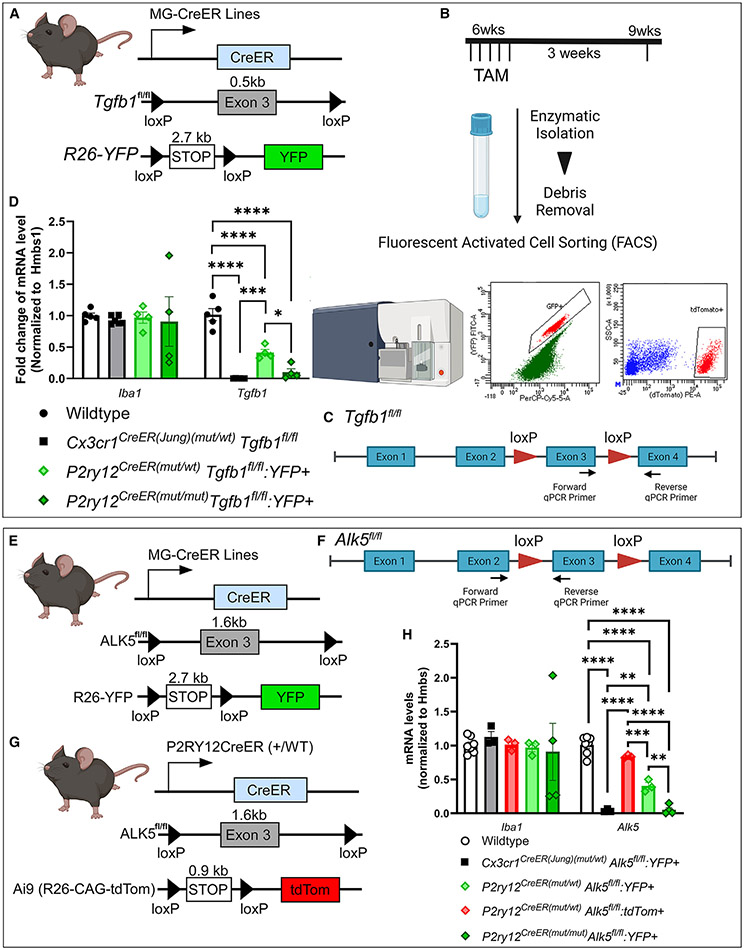
Figure 3. Evaluation of the gene deletion efficiency on distinct homozygous floxed target gene alleles in the Cx3cr1CreER(Jung) and P2ry12CreER drivers using real-time qPCR.
(A–D) Animal genotype and experimental flow. Total mRNA levels are evaluated for the floxed exon in the Tgfb1 gene in YFP+ microglia sorted from the Cx3cr1CreER(Jung)(mut/WT), P2ry12CreER(mut/WT)Tgfb1fl/flR26-YFP, or P2ry12CreER(mut/mut)Tgfb1fl/fl-R26-YFP mice 3 weeks after TAM treatment. YFP+ cells were selected based on fluorescein isothiocyanate (FITC) wavelength to detect YFP and PerCP-Cy5.5 to help delineate the actual YFP signal from autofluorescence commonly seen in sorted brain cells.
(E–H) Total mRNA levels are evaluated for the floxed exon in the Alk5 gene in either YFP+ microglia sorted from the Cx3cr1CreER(Jung)(mut/WT), P2ry12CreER(mut/WT)Alk5fl/flR26-YFP, or P2ry12CreER(mut/mut)Alk5fl/fl-R26-YFP mice or Ai9-tdTomato+ microglia from the P2ry12CreER(mutt/WT)Alk5fl/flAi9 mice 3 weeks after TAM treatment.
Each data point represents the average of 1 animal (the average for each animal is obtained by averaging 3 technical replications of the real-time qPCR reaction for that animal), and the average for each animal was used as a single data point for statistical analysis. Mean ± SEM. **p < 0.01, ***p < 0.001, ****p < 0.0001 for two-way ANOVA, Tukey post hoc pairwise analysis. Data are pooled from samples sorted either with or without transcriptional and translational inhibitors. Our data show that no difference was observed in Tgfb1 gene or Alk5 gene expression in sorted microglia with or without the inhibitors (see Figure S5). Also, see Figure S6 for no changes in Tgfb1 or Alk5 mRNA in VEH-treated mice.

