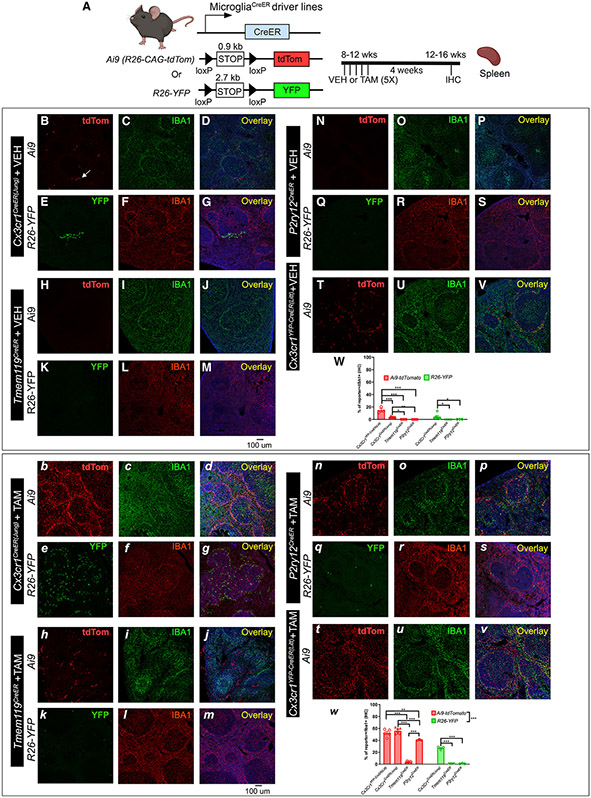
Figure 5. Evaluation of the splenic TAM-independent and TAM-dependent Cre recombination in the four different CreER driver lines using either the Ai9-tdTomato or R26-YFP reporter mouse lines.
The experimental timeline is shown in (A). Representative images from each Cre driver and reporter line (B–V for VEH treatment and b–v for TAM treatment). The Cre driver and the reporter line are indicated on the left. Quantification of reporter+ cells in the IBA1+ populations in the spleen is shown in (W) (for VEH treatment) and (w) (for TAM treatment). Each data point represents the average of 1 animal (the average for each animal is obtained by quantifying multiples spleen sections), and the average for each animal was used as a single data point for statistical analysis. Mean ± SEM. **p < 0.01, ***p < 0.001, two-way ANOVA, Tukey post-hoc pairwise analysis. Ai9 vs. R26-YFP is significantly different as a factor (p < 0.001 for the TAM-treated group). Data were combined from 2–3 independent cohorts of mice. Scale bar, 100 μm.

