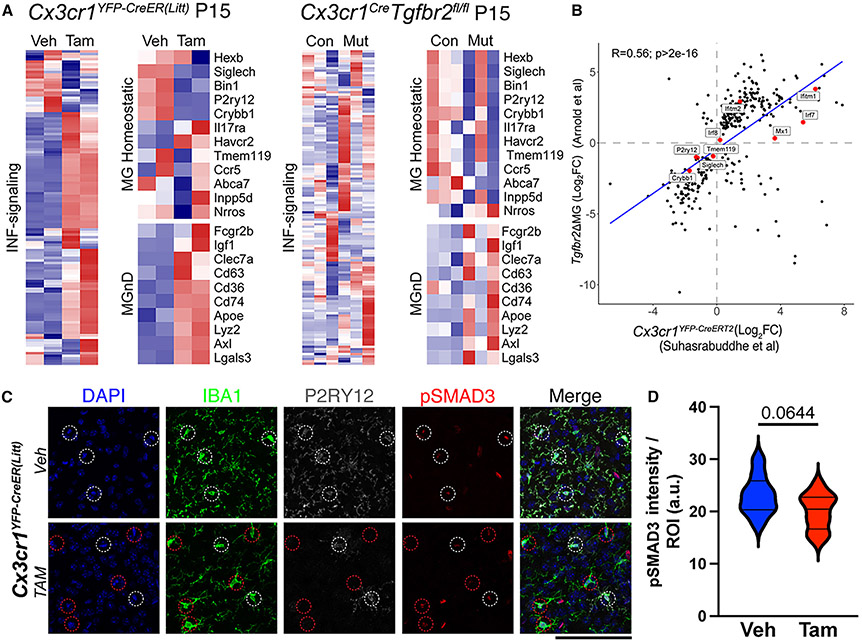
Figure 7. Similarity in microglia phenotypes from neonatal TAM -induced Cx3cr1YFP-CreER(Litt) and Tgfbr2fl/fl;Cx3cr1Cre mice.
(A) Transcriptomic phenotypes from P15 Cx3cr1CreER(Litt) (VEH vs. TAM) and Tgfbr2;Cx3cr1Cre (Tgfbr2fl/WT;Cre vs. Tgfbr2fl/fl;Cre) mice showing changes in INF signaling-related, MgND/DAM, and homeostatic gene expression.
(B) Correlation between two datasets.
(C) Brain sections from P15 Cx3cr1CreER(Litt) (VEH vs. TAM) mice stained for DAPI (blue), IBA1 (green), P2RY12 (gray), and pSMAD3 (red).
(D) Quantification of pSMAD3 mean fluorescence intensity in individual microglia from each group shows no significant difference in pSMAD3 (mean ± SEM, p = 0.0644, Student’s t test). A red circle in (C), bottom row, indicates the P2RY12− microglia.
Data were combined from 3 VEH-treated and 4 TAM-treated mice. Scale bars, 100 μm.

