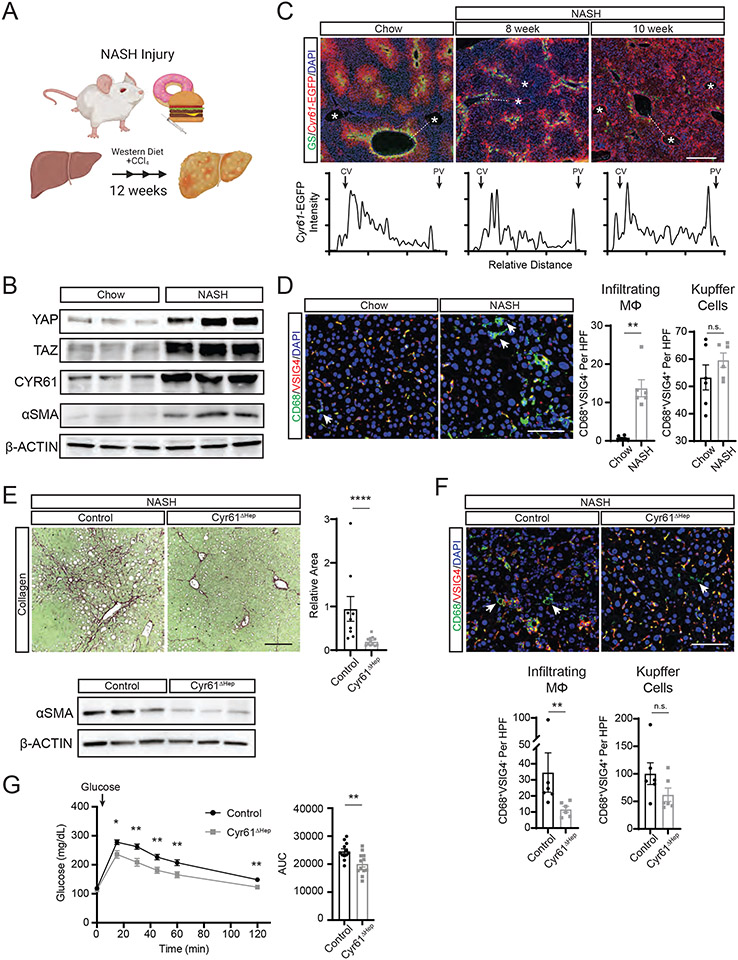
Figure 1. Cyr61 drives fibrotic injury in NASH.
(A) Cartoon of 12-week NASH injury in mice and associated biological analyses. (B) Immunoblot of indicated protein expression in whole livers of mice on chow diet or 12 weeks NASH diet. (C) Representative immunofluorescence imaging of GS (green) and Cyr61-EGFP (red) in livers from Cyr61-EGFP reporter mice on chow diet or on 8 or 10 weeks of NASH diet. Asterisks (*) indicate portal regions. Scale bar=400μm. Below: intensity of Cyr61-EGFP staining across dotted line from central vein (CV) to portal vein (PV). (D) Representative immunofluorescence imaging of specified proteins in livers from mice on chow diet (n=6) or 12 weeks of NASH diet (n=6). Scale bar=100μm. Quantification of infiltrating MΦs (CD68+VSIG4−) and Kupffer cells (CD68+VSIG4+) to the right. HPF=high power field. Arrows indicate CD68+VSIG4− cells. (E) Representative picrosirius red staining of livers from Cyr61 fl/fl mice treated with AAV8-TBG-GFP (control, n=9) or AAV8-TBG-CRE (Cyr61ΔHep, n=12) on NASH diet for 12 weeks. Scale bar=200μm. Quantification to the right. Below: Immunoblot of αSMA expression in whole livers of control or Cyr61ΔHep mice on 12 weeks of NASH diet. (F) Representative immunofluorescence imaging of specified proteins in livers from control (n=6) or Cyr61ΔHep (n=6) NASH mice. Arrows indicate CD68+VSIG4− cells. Scale bar=100μm. Quantification of infiltrating MΦs (CD68+VSIG4−) and Kupffer cells (CD68+VSIG4+) below. (G) Serum glucose measured in control (n=12) or Cyr61ΔHep (n=12) mice at indicated time points after glucose challenge (indicated by arrow). Fasting glucose was measured at 0 minutes. Area under the curve (AUC) calculation plotted to the right. Mean and SEM plotted; p value calculated with Mann-Whitney U test. *p<0.05, **p<0.01, ****p<0.0001

