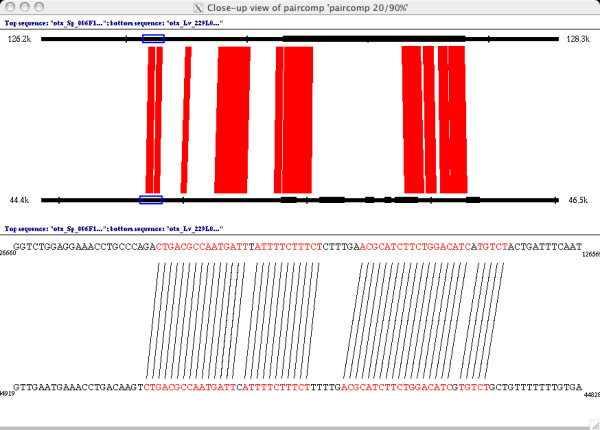
Figure 3.

A closeup view of the paircomp comparison of the genomic sequence surrounding the first exon of otx in S. purpuratus (top sequence) and L. variegatus (bottom sequence). The top half of the closeup view shows orthologous 2 kb genomic regions (126.2 kb – 128.3 kb in the S. purpuratus BAC, 44.4 kb – 46.5 kb in the L. variegatus BAC). Matches of 19/20 or 20/20 bases are drawn in red between the sequences, and the exon matches from Figure 2 are shown in black on the sequence lines. The bottom half of the closeup view shows the part of the sequence selected in blue on the top half of the view. Lines are drawn in black between individual matching bases, and the matching bases are colored in red. Note that both blocks shown match at 19/20 because of the single mismatch in the middle of the blocks.
