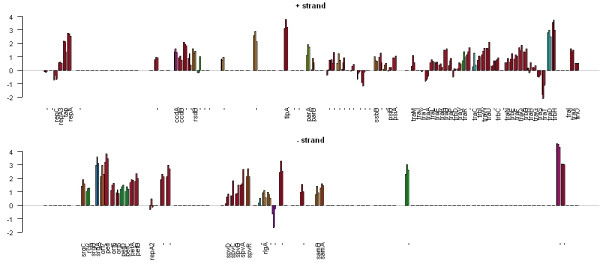
Figure 1.

Gene expression measurements for Salmonella typhimurium plasmid pSLT. Gene expression measurements for the pSLT plasmid of Salmonella typhimurium. The genome is represented as two barplots, one for each strand. Each gene has three bars representing expression at 4 h, 8 h and 12 h post macrophage infection. Gene expression measurements (y-axis) are ratios of test RNA to control RNA on the log 2 scale. Bars are colour-coded according to the COGs [12] functional category. Distance between genes is relative and representative of intergenic distance. This image clearly shows that the majority of genes on the plasmid are up-regulated during macrophage infection.
