
Figure 2.
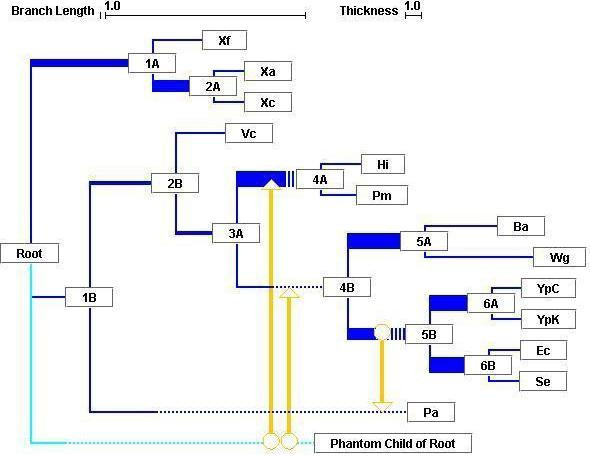
Synthesis diagram. The vertical-inheritance backbone representing the input reference tree is shown in dark blue, with the line thickness of an internal branch corresponding to the frequency of its support across the whole dataset. Putative LGT events are in orange, connecting donors (circles) with recipients (arrowheads); where there are multiple possible donor candidates, these converge onto a double arrowhead (see text). Where the apparent donor of a gene falls outside of the taxa included in the analysis, one is created as a basal group taxon, indicated in light blue. In order to avoid graphical congestion, branches in the tree may be artificially extended, as dotted segments. Colours are editable, and links are interactive. Clicking on node 3A, for example, displays the following message: 3A: set006r, branch length:0.03755, thickness:0.25, files supported: mvin.tre:2/2, where support for the node is 2/2 for mvin.tre (both edit paths support the node), and 0 (unsupported) for hypoprot.tre, biob.tre and n6methylase.tre. The segment's thickness, therefore, is simply (2/2)/4.