
Figure 3.
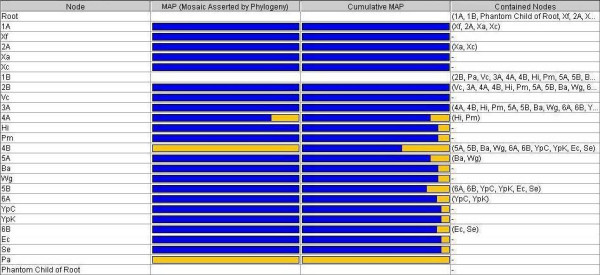
Estimate of genomic mosaicism. This application screenshot displays a table indicating the degree of vertical and of horizontal inheritance inferred for each node in the synthesis (see Fig. 2). The middle two columns of the table summarize the distribution of vertical (blue) and of lateral (orange) support for the segment immediately preceding each node, and the vertical and lateral support for the whole string of segments leading to a particular node, respectively. For example, B. aphidicola shows a 14% degree of accumulated mosaicism since the tree's root (from the small sample of genes used in this analysis), but no recent mosaicism (in the segment preceding its divergence from W. glossinidia, node 5A). Numerical values for the proportions are given by clicking on a bar. Node 1B is left entirely blank for want of phylogenetic evidence.