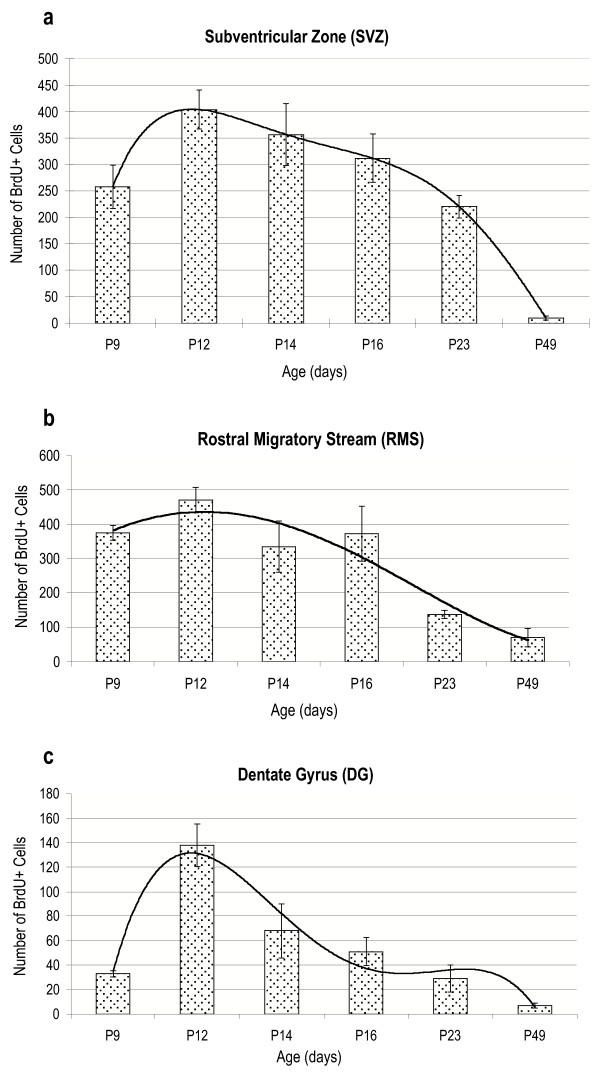
Figure 2.
Temporal dynamics of proliferation in the germinative zones of control brains. Trends of cell proliferation in the postnatal rat brain, from P9 to P49, in the SVZ (a), RMS (b), and DG (c) are shown. Peak proliferation was always seen at P12. Curves were calculated using a polynomial regression line (order = 5, period = 2).

