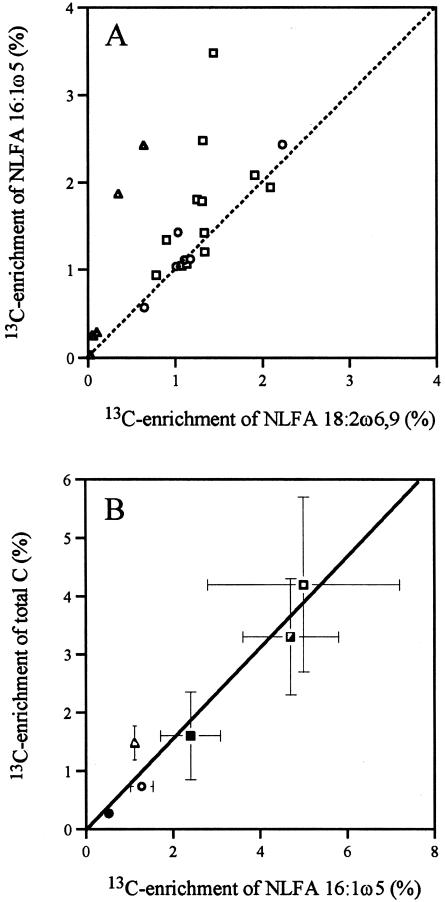
FIG. 2.
Comparisons of 13C enrichment of NLFA 16:1ω5 to enrichment of NLFA 18:2ω6,9 and total C. (A) Plant roots studied in three experiments where the dotted line represents k = 1. (B) AM fungal mycelium across four experiments (y = 0.77x, r2 = 0.94, P < 0.01). Triangles indicate monoxenic time course study, squares indicate monoxenic P experiment (open squares denotes no P, half-filled squares indicate low-P, and filled squares indicate high-P), open circles represent experiments with multiple plant hosts (extracted intraradical mycelium was used for determination of total hyphal 13C in panel B), and closed circles represent the sand compartment study. Means (n = 2 for the monoxenic time course study, n = 12 for the monoxenic P experiment, 6 for experiment with multiple plant hosts and 30 for sand compartment study) ± the SE; where no error bars can be seen, the SE is smaller than the symbol.

