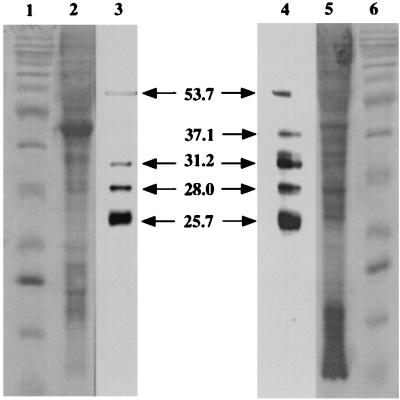
FIG. 5.
Western blot of ovine tracheal epithelium and lung homogenate. Lane 1, protein ladder (10 to 200 kDa) standard; lane 2, tracheal-cell homogenate stained with Coomassie blue; lane 3, tracheal-cell homogenate probed with antibody PAB96-1; lane 4, lung homogenate probed with antibody PAB96-1; lane 5, lung homogenate stained with Coomassie blue; lane 6, protein ladder standard. In tracheal epithelial cells, antibody PAB96-1 identified four bands with molecular masses of 53.7, 31.2, 28.0, and 25.7 kDa. In the lung, antibody PAB96-1 identified five bands with molecular masses of 53.5, 37.1, 31.2, 28.0, and 25.7 kDa. Identical results were seen with antibody 1G9-1C2 (data not shown). As controls, strips of membrane containing separated tracheal and lung proteins were incubated with preimmunized rabbit serum (1:200), preimmunized mouse serum (1:200), or peroxidase-labeled goat anti-rabbit IgG (0.5 μg/ml) or goat anti-mouse IgG (0.5 μg/ml). No reactions were seen (data not shown). In addition, preincubation of antibody PAB96-1 (5 μg/ml) or 1G9-1C2 (5 μg/ml) with 1.0 mM H-DDDDDDD-OH eliminated specific staining of all bands (data not shown). Blots were photographed (digital camera RD-175; Minolta), and the sizes of the reactive bands were determined (GelCompar, v. 4.0; Applied Maths) by extrapolation from a standard curve of the sizes of the stained bands on the protein ladder.

