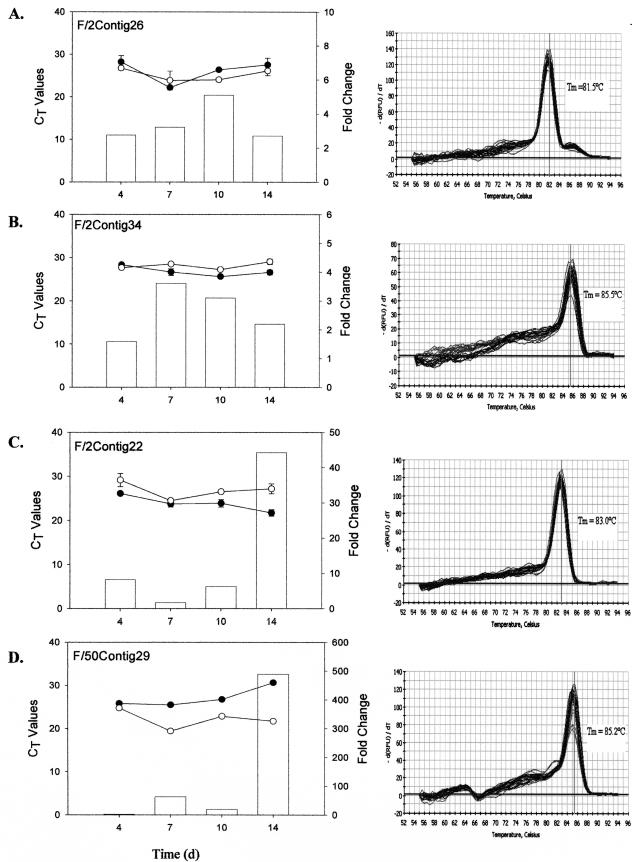
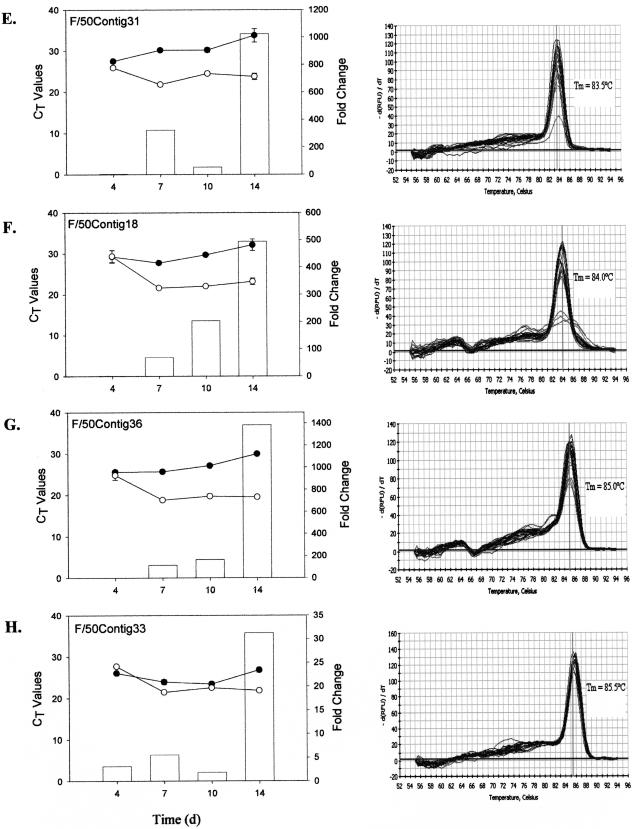
FIG. 4.
Real-time RT-PCR results showing temporal expression patterns of individual cDNA transcripts from the f/2-specific (A to C) and f/50-specific (D to H) SSH libraries over a 14-day period. Total RNA was isolated from E. huxleyi cells grown in either f/2 (•) or f/50 (○) medium. mRNA transcript abundance is inversely proportional to the cycle threshold (CT) value. Change (n-fold; bars) at each time point was calculated as 2ΔCt and expressed as the relative difference in expression in f/50 versus f/2. The data represent the mean of three replicates per time point, and standard deviations are expressed as error bars. d, days.


