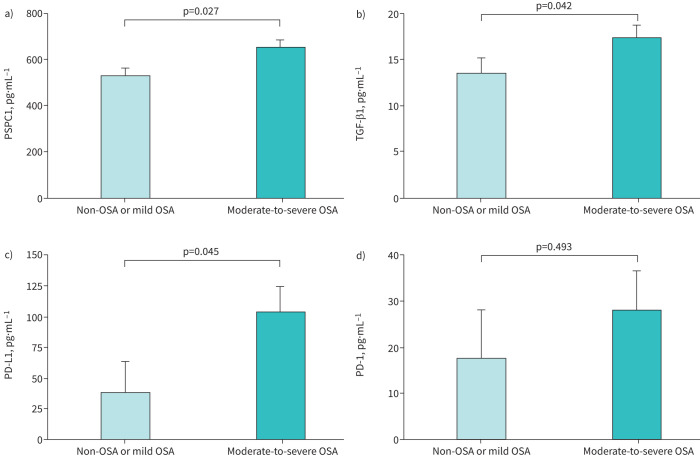
FIGURE 3.
Biomarker levels in patients with lung cancer. Adjusted comparisons of the serum levels of soluble a) paraspeckle component-1 (PSPC1), b) transforming growth factor-β1 (TGF-β1), c) programmed cell death ligand-1 (PD-L1) and d) programmed cell death-1 (PD-1) according to presence and severity of obstructive sleep apnoea in subjects from the SAIL cohort. Bars correspond to the mean adjusted for age, sex, body mass index, pack-years and previous COPD diagnosis. Error bars represent the standard error of the mean. p-values correspond to between-group comparisons by general linear models with post-hoc comparisons by Bonferroni test.

