
FIG. 3.
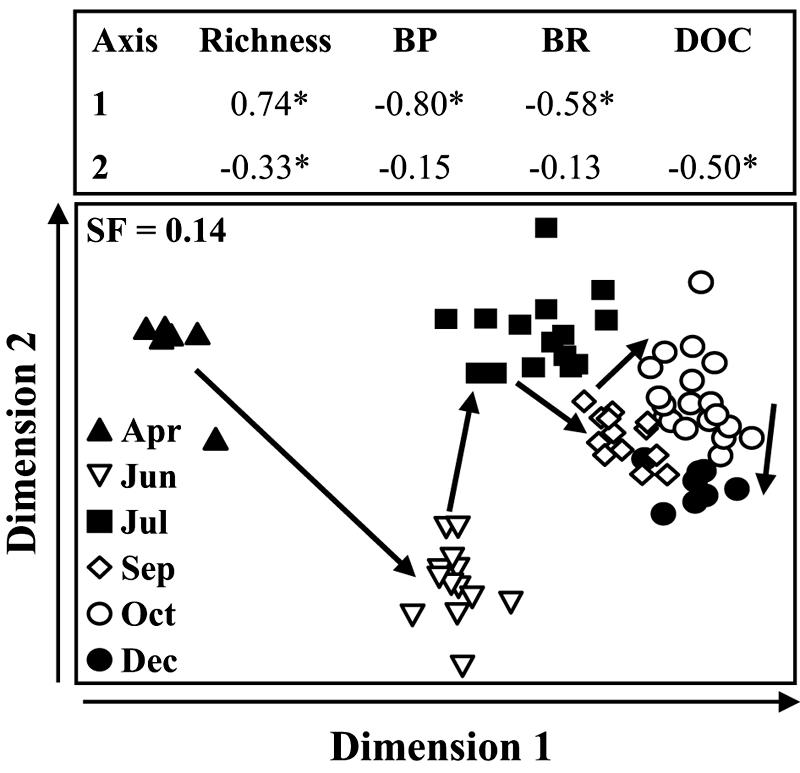
Two-dimensional MDS plot of T-RFLP patterns of the bacterioplankton community of the southern North Sea. The configuration found by MDS was based on a Bray-Curtis similarity matrix for the bacterial richness between the stations. The months are indicated by different symbols. The arrows inside the panel indicate the seasonal sequence from spring to winter. The arrows on dimensions 1 and 2 indicate the directions in which scores increase. Spearman rank correlations were calculated between the scores of the dimension found for the different stations and bacterial richness, bacterial production (BP), bacterial respiration (BR), chlorophyll a (Chl a), dissolved organic carbon (DOC), and temperature (T). SF, stress factor; *, P < 0.01.