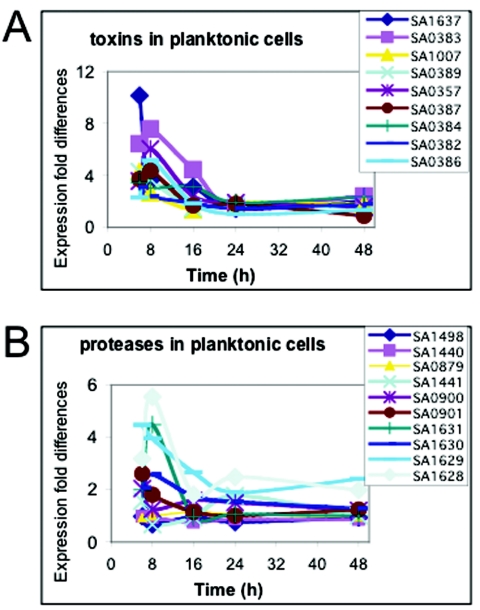
FIG. 3.
Comparisonof the expression profiles of genes encoding toxins and proteases in biofilm and planktonic cultures. Microarray analysis was performed and expression levels were determined as described in the legend to Fig. 1. The data indicate the fold differences in expression of genes in planktonic cells compared to the expression in biofilm cells. (A) Expression pattern of genes encoding toxins, including the leukotoxin LukD (SA1637), exotoxin 7 (SA0383), exotoxin 13 (SA0389), exotoxin 8 (SA0384), exotoxin 10 (SA0386), an alpha-hemolysin precursor (SA1007), a protein similar to exotoxin 2 (SA0357), and exotoxin 6 (SA0382). (B) Expression pattern of genes encoding proteases, including protease ClpX (SA1498), a protein similar to protease (SA1440), serine protease HtrA (SA0879), a protein similar to protease (SA1441), a cysteine protease precursor (SA0900), serine protease (SA0901), serine protease SplA (SA1631), serine protease SplB (SA1630), serine protease SplC (SA1629), and serine protease SplD (SA1628).

