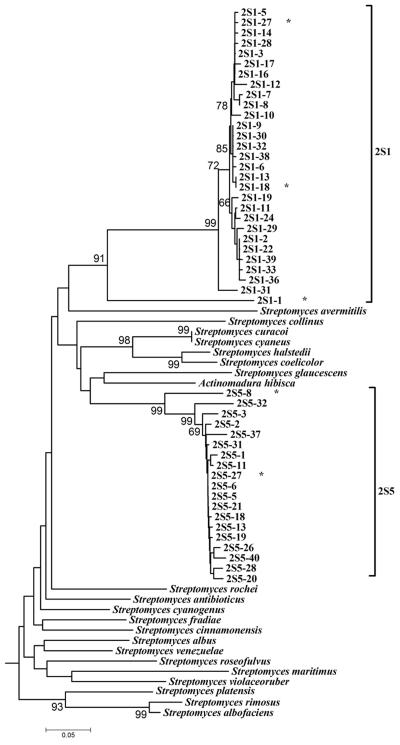
FIG. 2.
Phylogenetic analysis of DNA sequences obtained by cloning of KSα PCR products from samples 2S1 and 2S5, which were chosen because they contained a large number of peaks in their actinomycete 16S TRFLPs. Species names indicate sequences obtained from GenBank. A subset of GenBank sequences used to design the PCR primer set as well as GenBank sequences most similar to cloned sequences (Actinomadura hibisca for 2S5 and Streptomyces antibioticus for 2S1 clones) was used for analysis. Numbers indicate bootstrap percentages. Only bootstraps >65% are shown. A star (*) after a sequence identifier indicates that this sequence and its identity to other sequences are shown in Table 2.

