
Figure 1.
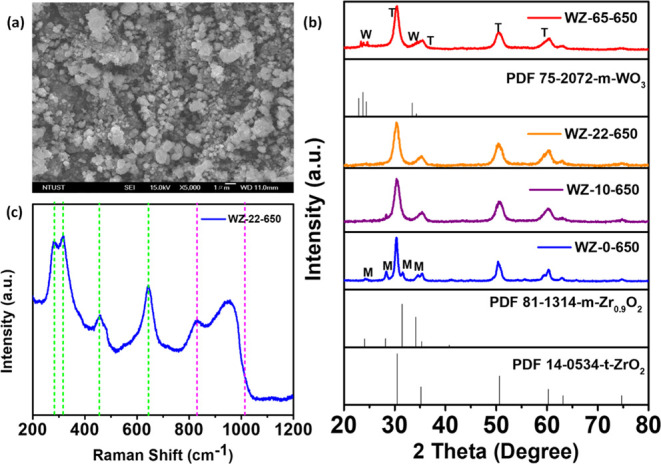
(a) FE-SEM image, (b) XRD patterns of different W contents: (t-ZrO2: tetragonal, m-ZrO2: monoclinic, and monoclinic tungsten phase: m-WO3), and (c) WZ Raman spectrum of WZ at 650 °C.
Official websites use .gov
A
.gov website belongs to an official
government organization in the United States.
Secure .gov websites use HTTPS
A lock (
) or https:// means you've safely
connected to the .gov website. Share sensitive
information only on official, secure websites.
(a) FE-SEM image, (b) XRD patterns of different W contents: (t-ZrO2: tetragonal, m-ZrO2: monoclinic, and monoclinic tungsten phase: m-WO3), and (c) WZ Raman spectrum of WZ at 650 °C.