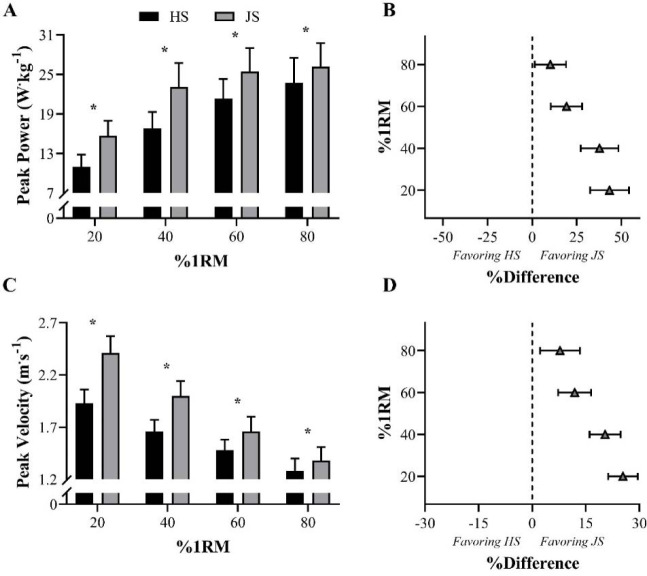
Figure 3.
Comparison of peak power and peak velocity between half-squat (HS) and jump squat (JS) exercises across different loads. * Indicates significant differences between the two exercises (p< 0.05). Panels A and C display means and standard deviations, while panels B and D show percentage differences and 95% confidence limits. %1RM = percentage of HS 1RM (Loturco et al., 2023d).

