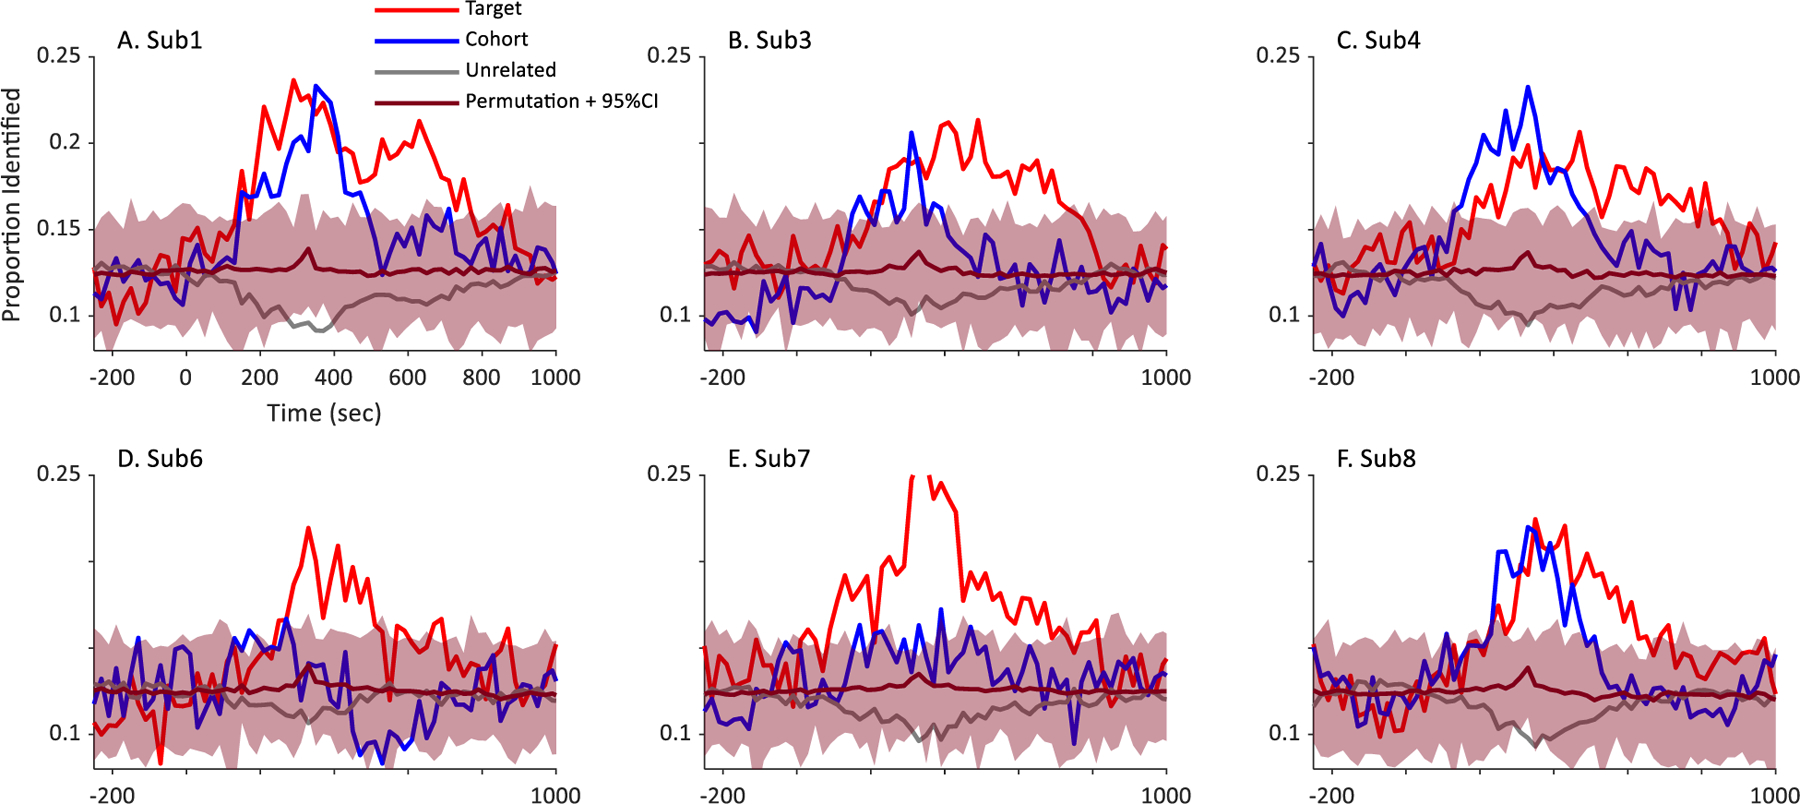
Fig. 4.

Results of a permutation test conducted on fix individual subjects. Shown is each subject’s proportion of target, cohort, and unrelated identifications over time (e.g., Fig. 3, main text). The magenta bar represents the mean of 100 runs in which the assignment of stimuli to trials was randomized; the confidence intervals represent the values between which 95% of the observed results fell. Note that subjects 1,3 and 4 (top row) were subjects on which the initial feature identification was conducted; subjects 6–8 (bottom row) were not.
