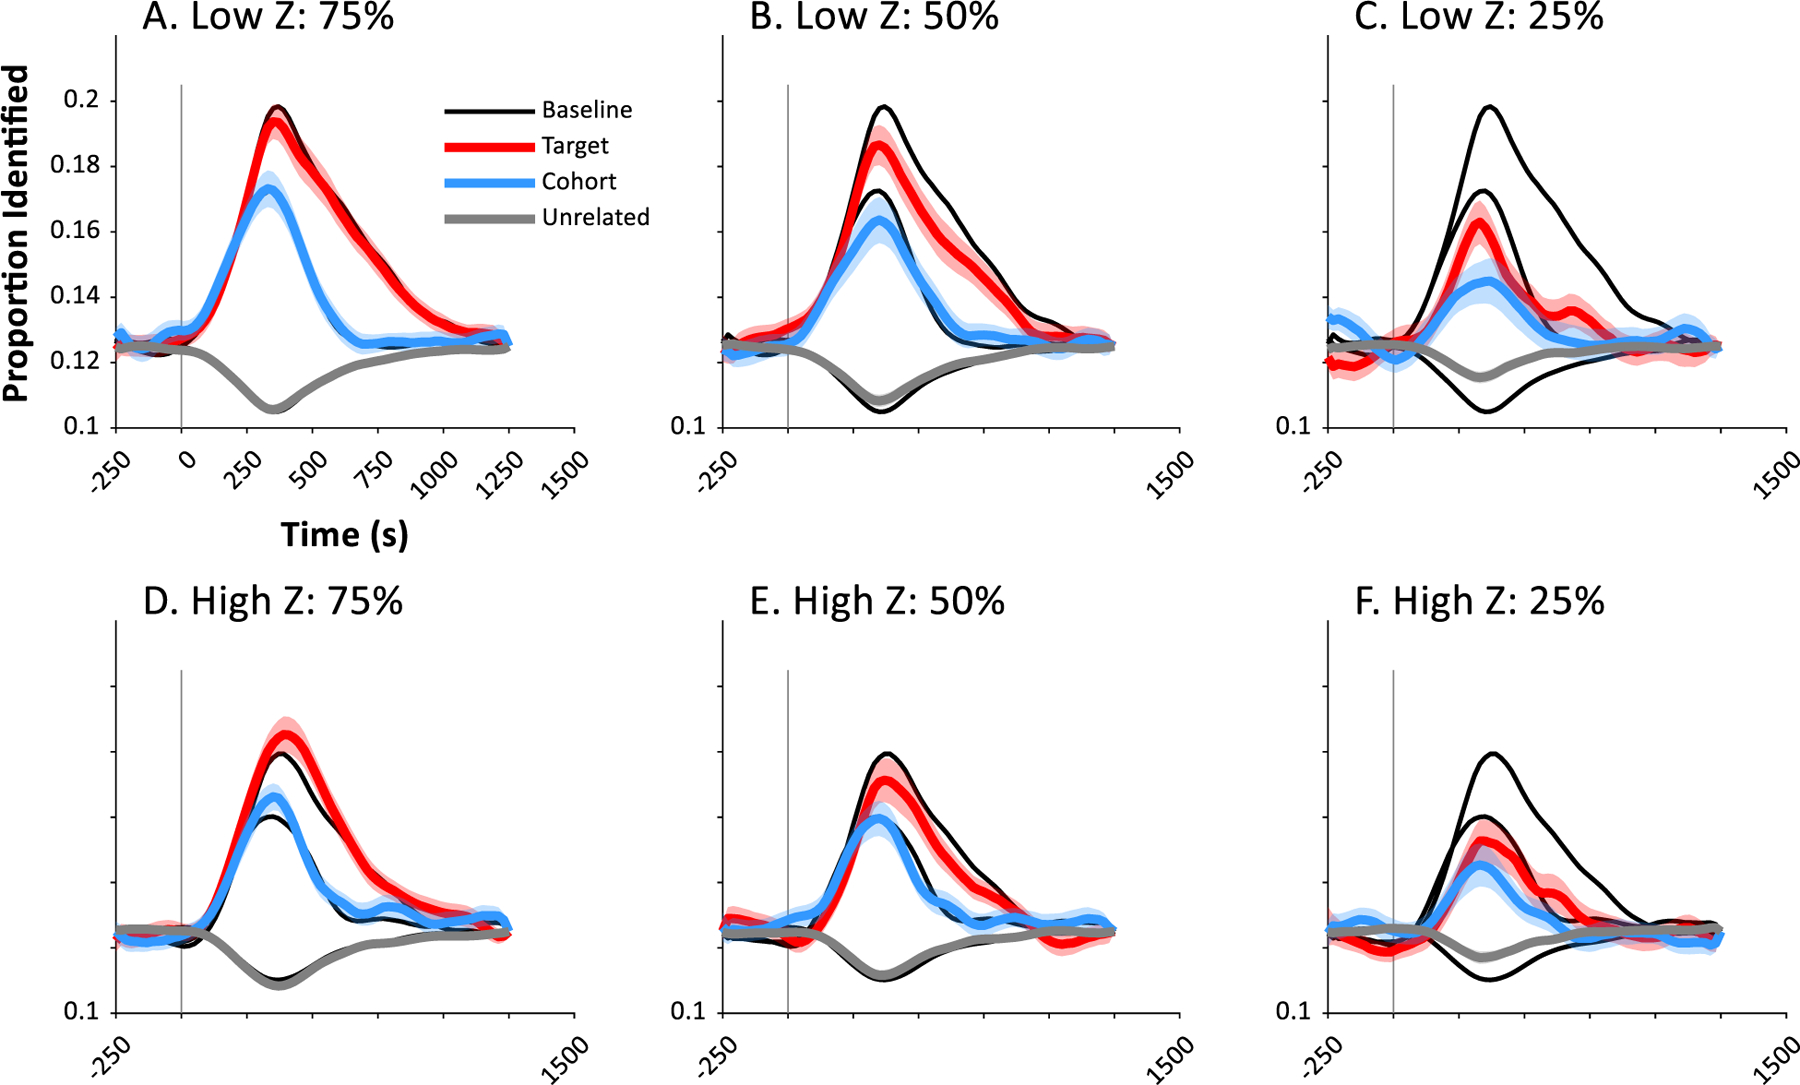
Fig. 6.

Effect of number of trials on performance. In each curve, the black represents the original data trained on 100% of trials (e.g., Fig. 2, main text). Colored curves are the same results trained on the first 75%, 50% or 25% of trials. Top row: Low impedance systems; Bottom row: High impedance.
