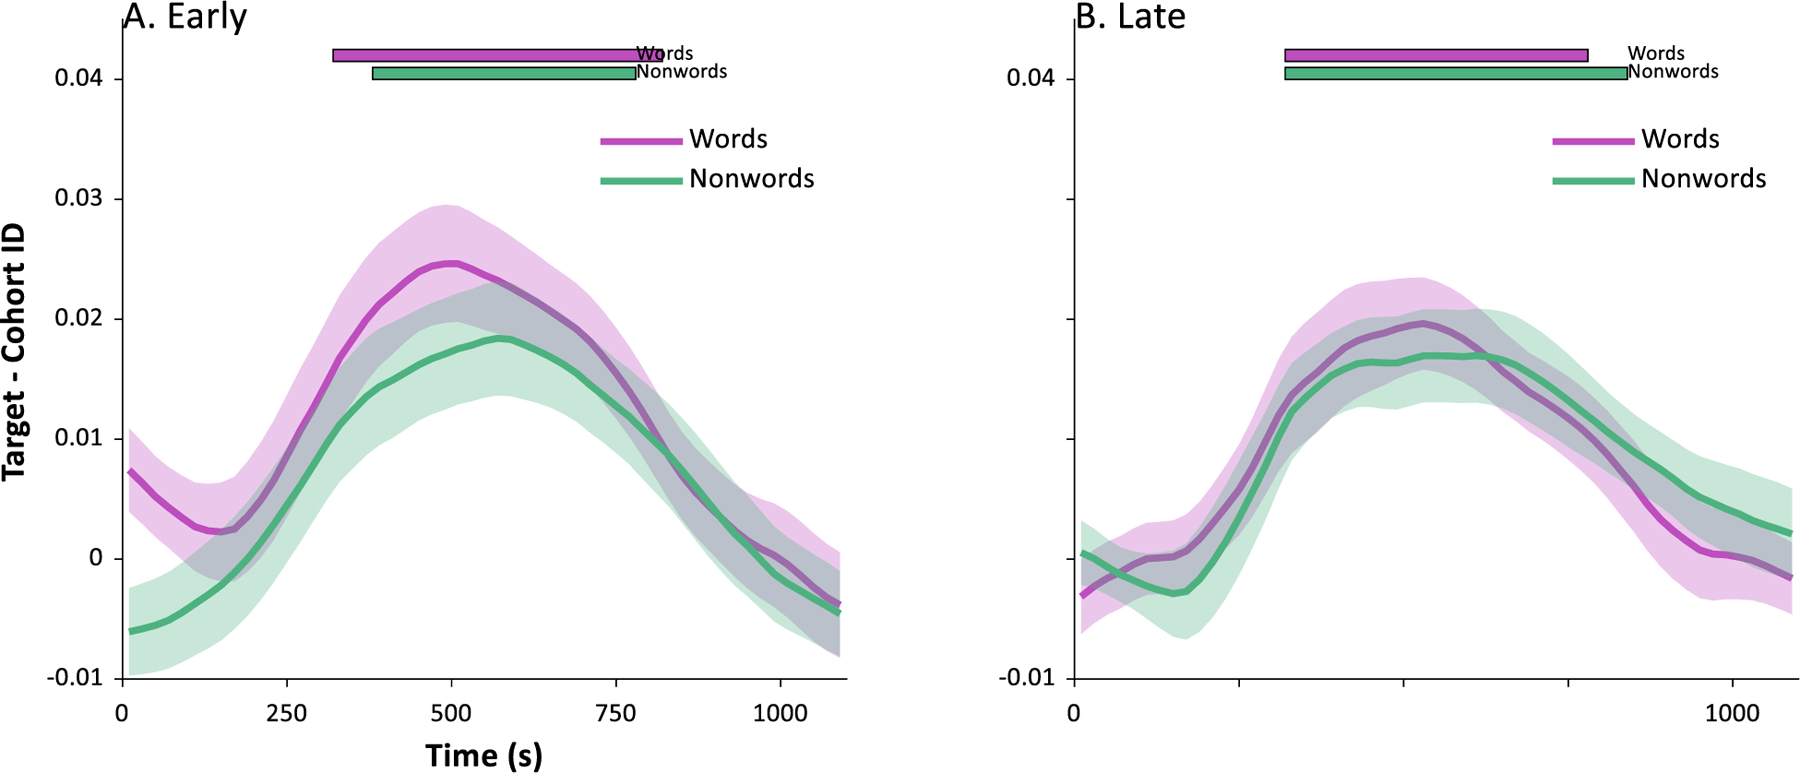
Fig. 9.

Target minus competitor identification rates as a function of time and time in the experiment. Results are pooled over both samples. Here, a value of 0 indicates that the target did not differ from the cohort. A) Early trials (1st half of trials). B) Late trials (2nd half of trials). Significance bars test the difference between target and cohort at each time (corrected for family wise error), asking if the curve deviates from 0. At no point did the curves significantly differ from each other. (early vs. late trials) on performance.
