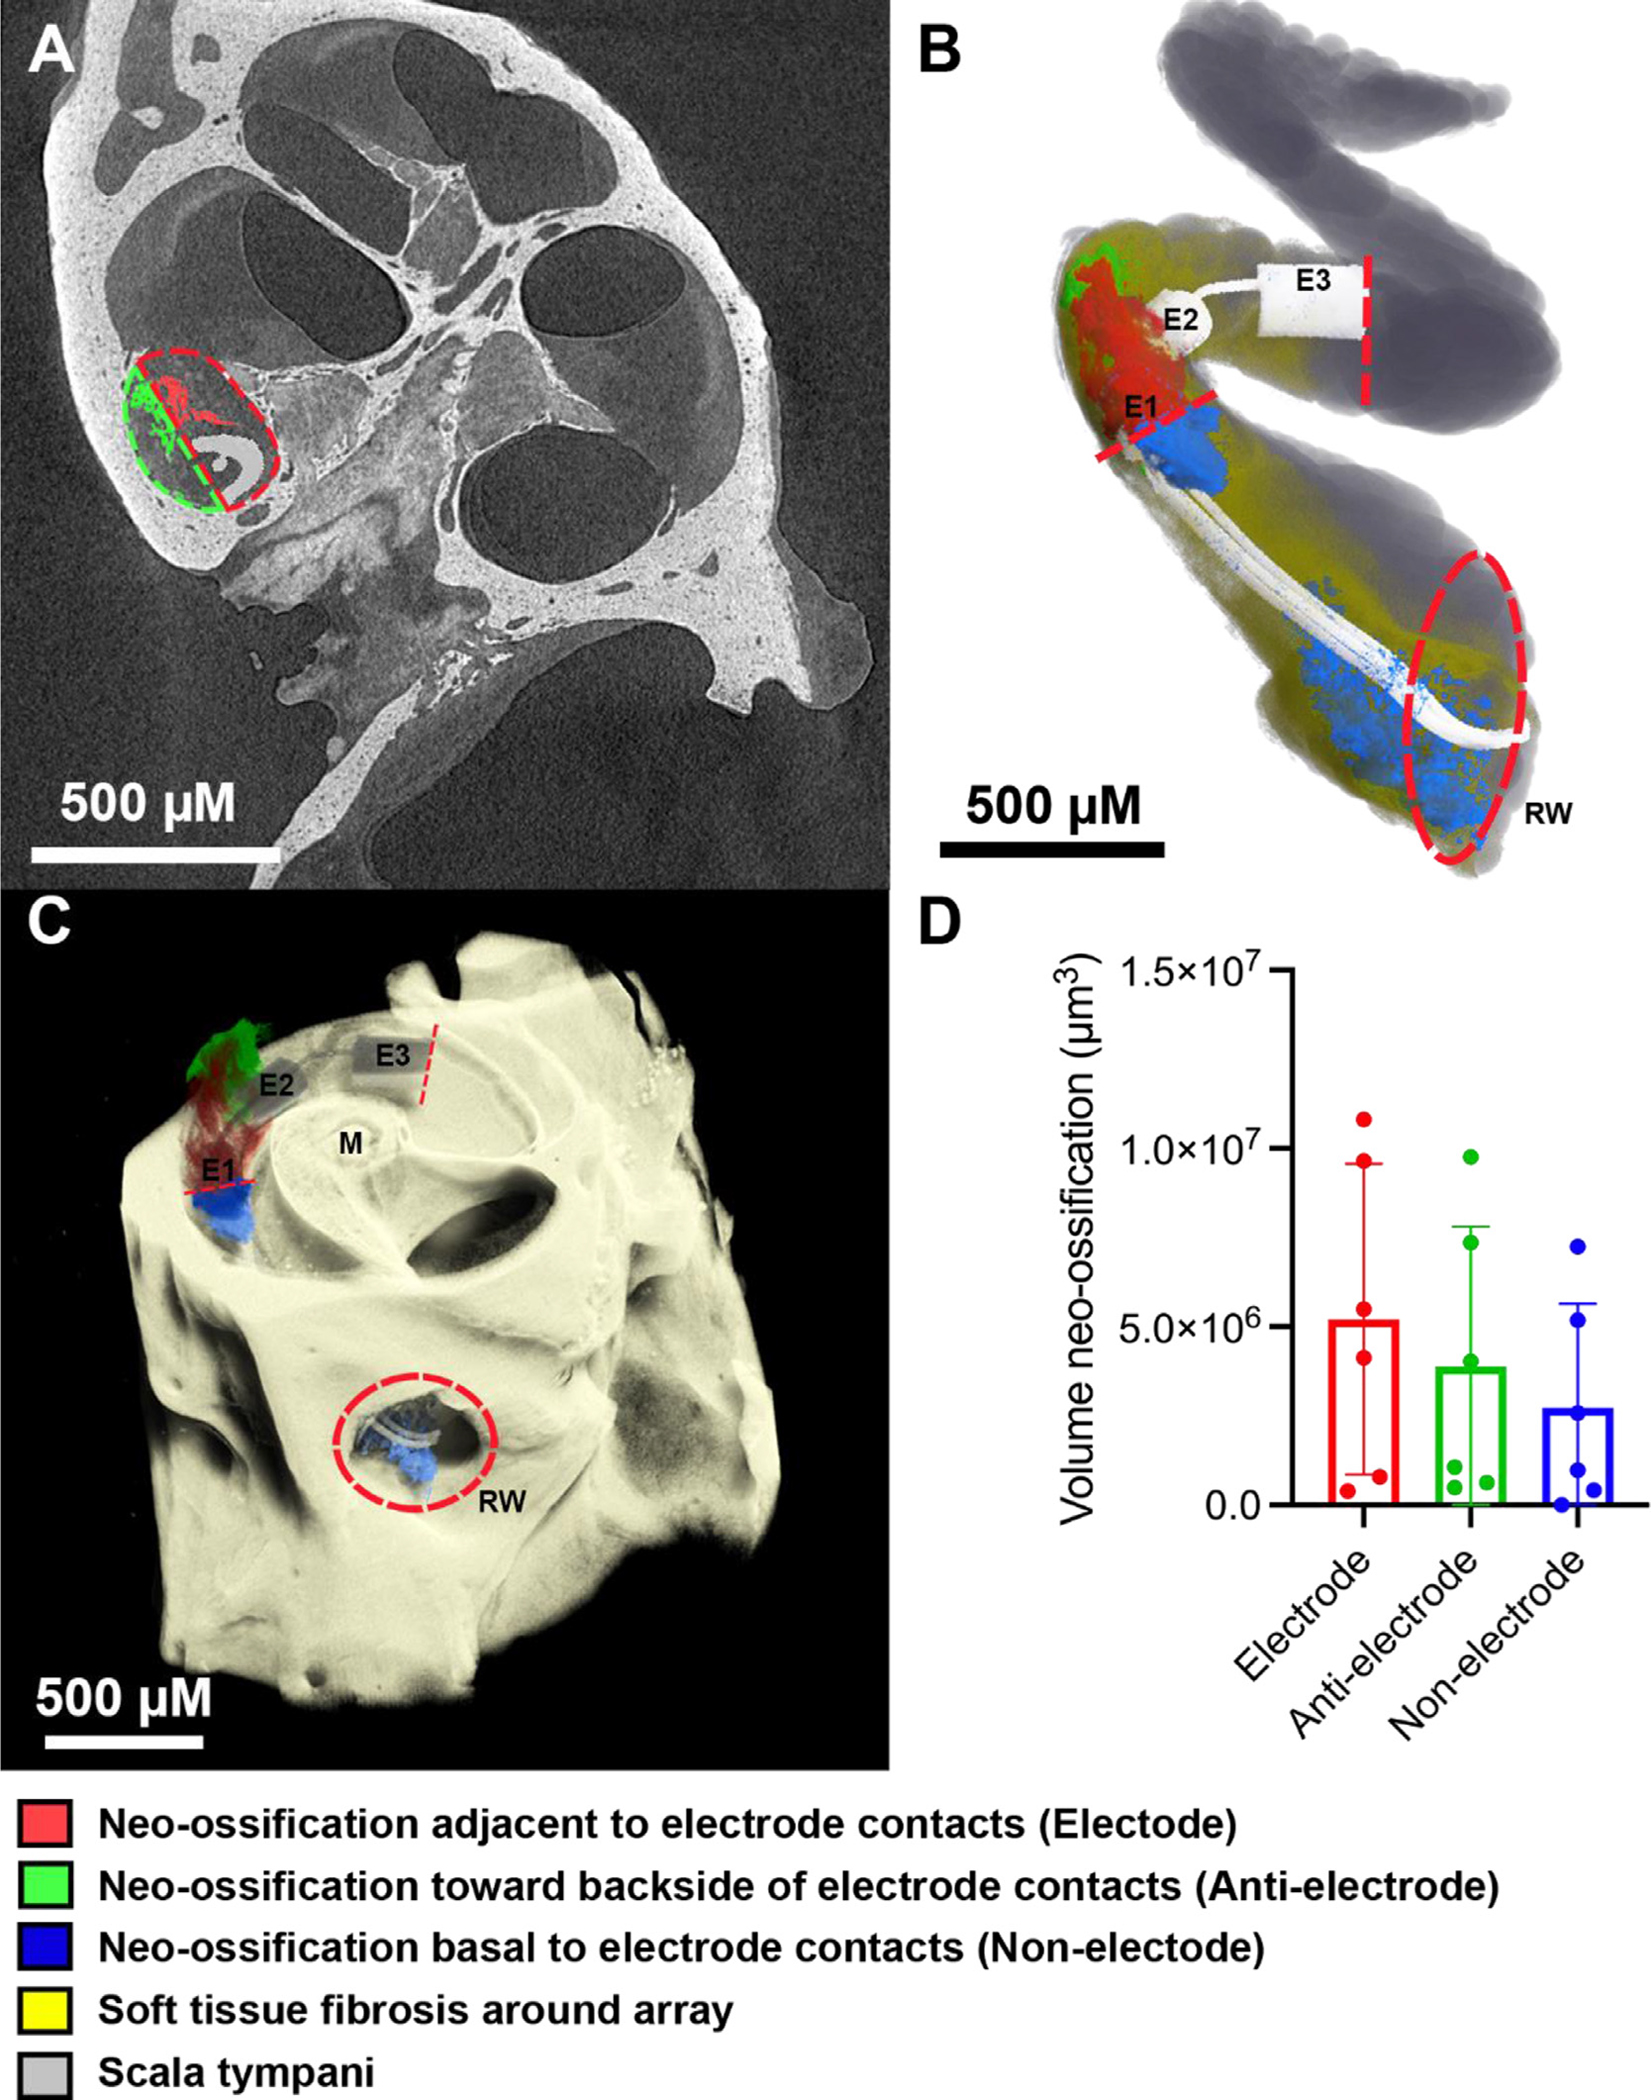
Fig. 7.

Intracochlear neo-ossification relative to platinum and PDMS bearing surfaces. 3D X-ray microscopy images of a single chronically implanted mouse cochlea (A,B,C) with the CI imaged in-situ were volumetrically segmented to compare the amount of neo-ossification in 3 separate areas: the area immediately adjacent to platinum electrode surfaces “Electrode” (red), the area adjacent to PDMS surfaces toward the backside of the electrode contact surface “Anti-electrode” (green), and the intracochlear portions basal to the E1 electrode “Non-electrode” (blue). Dashed lines in (A) denote the manual separation of the “Electrode” (red) and “Anti-electrode” (green) areas in which neo-ossification was volumetrically quantified and in (B,C) indicate the basal and apical limits confining the “Electrode” and “Anti-electrode” areas, with the “Non-electrode” area being basal to this area, stopping at the round window. “E1”, “E2” and “E3” denotes electrode contacts 1,2 and 3, respectively; “M” denotes modiolus; “RW” denotes the round window outlined by a red hashed circle in (B,C). The gray and dark yellow shading in (B) represent the open scala tympani space and areas of soft tissue fibrosis without neo-ossification, respectively. Mean quantification of volume of neo-ossification across n = 6 subjects with individual data points noted as dots and error bars representing 1 standard deviation is shown in (D). The greatest volume of neo-ossification was seen in the “Electrode” area immediately adjacent to the Platinum electrodes, followed by the “Anti-electrode” and “Non-electrode” areas, however these differences were not significant (p > 0.05).
