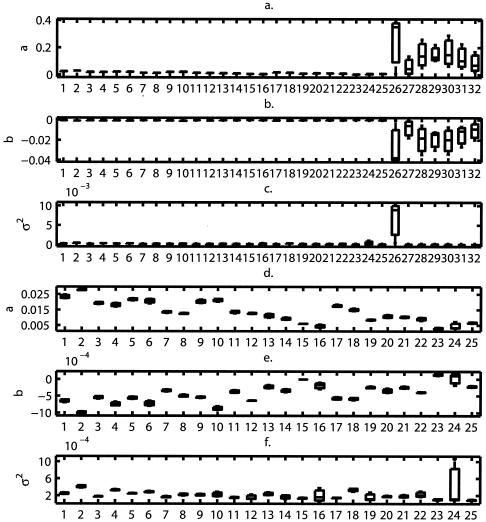
FIG. 3.
Box plots of the stochastic Ricker model parameter estimates as a function of the design type for treatments 1 to 32 (a, b, and c) and for designs 1 to 25 (d, e, and f). The bar inside the box indicates the median, the boxes delimit the interquartile range, and the vertical lines extend to the maximum and minimum.

