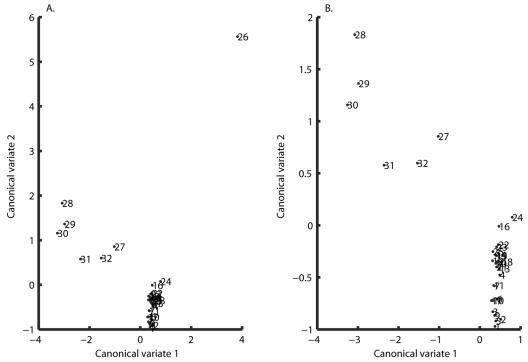
FIG. 4.
(Left) Experimental treatments plotted in a two-dimensional space according to their mean coordinate values in canonical variates 1 and 2. (Right) Same as before, but treatment 26 is excluded for clarity. The two canonical variates represent the two axes in the three-dimensional space of a, b, and σ2 along which the highest separation of the data points is obtained, i.e., these are the vectors along which most of the variability seen in the values of the model parameters occurs. Hence, two treatments for which the biochemical environment leads to similar growth patterns will appear closer when plotted in the two-canonical-variates space.

