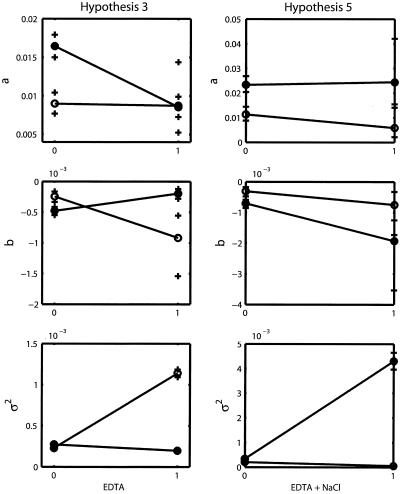
FIG. 5.
Interaction plots for hypothesis 3 and hypothesis 5. (Left) Closed circles represent absence of NaCl, open circles, presence of NaCl. (Right) Open circles represent absence of both NH4Cl and HCl, closed circles, presence of both chemicals. Parametric bootstrap confidence limits are marked with crosses.

