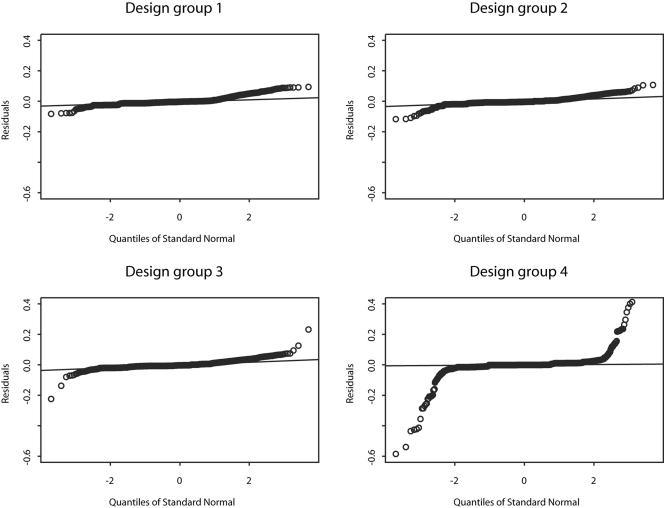
FIG. 6.
Plotted are the quantile-quantile graphs of the residuals for each of the four experimental design groups in hypothesis 3 (see “Model selection” for details). The points far from the straight lines in the lower right plot represent the individual model residuals that deviated from the model normality assumption.

