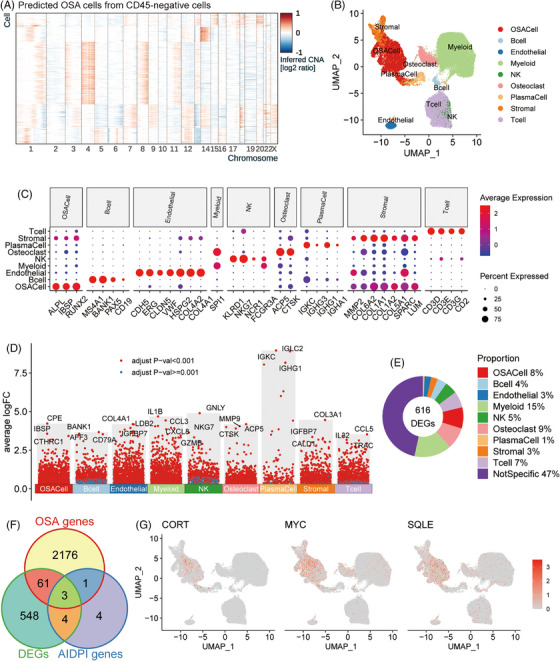
FIGURE 4.

Identifying therapeutic targets for high‐artificial intelligence‐derived prognostic index (AIDPI) patients: (A) A heat map shows inferred CNA in predicted osteosarcoma (OSA) cells, (B) a uniform manifold approximation and projection (UMAP) plot of nine annotated cell types, (C) a bubble plot displays marker gene expression across nine identified cell clusters, (D) in a Manhattan plot, genes highly expressed in specific cell clusters are pinpointed, (E) a donut chart displays the cellular sources of differentially expressed genes (DEGs) between the two AIDPI groups, (F) a Venn diagram presents shared entities among the indicated gene groups and (G) feature plots display normalized expression of the indicated genes across individual cells.
