
FIGURE 5.
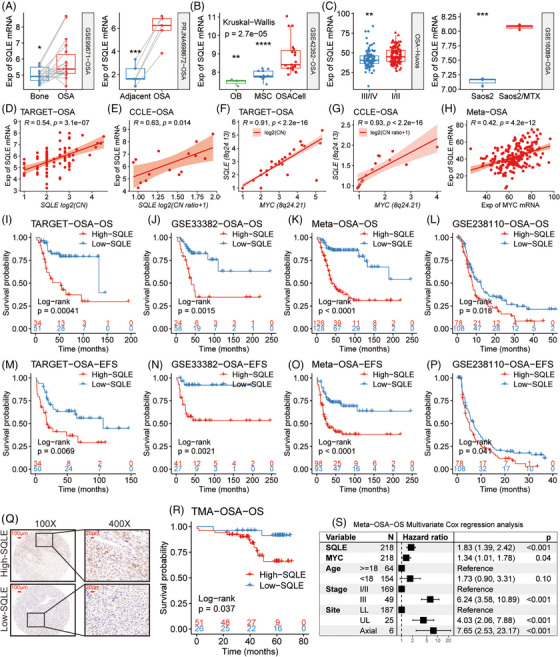
Overexpression of squalene epoxidase (SQLE) in osteosarcoma (OSA) correlates with tumour progression. (A–C) Boxplots demonstrate SQLE mRNA levels, contrasting OSA tissues versus their adjacent normal counterparts (A), OSA cell lines (OSACell) versus osteoblasts (OB) and mesenchymal stem cells (MSC) (B), samples with different Huvos grades and methotrexate‐resistant Saos2 (Saos2/MTX) versus its parent cell line (C). (D and E) Scatter plots show the relationships between copy number and mRNA level of SQLE in OSA samples and OSA cell lines. (F and G) Correlations between gene‐level copy numbers for MYC and SQLE are portrayed through scatter plots in OSA samples and OSA cell lines. (H) A scatter plot shows the correlation between the mRNA expression of MYC and SQLE in the indicated datasets. (I–P) Kaplan–Meier survival analyses of SQLE mRNA levels were performed across multiple human and canine OSA cohorts. (Q) Representative images of immunohistochemical (IHC) staining of SQLE in the TMA. (R) Kaplan–Meier survival analysis of a tissue microarray (TMA) consisting of 26 OSA patients with low SQLE expression and 51 OSA patients with high SQLE expression. (S) A forest plot shows the results of multivariate Cox regression analysis. CN, copy number; Exp, expression. *p < .05; **p < .01; ***p < .001; ****p < .0001, by Wilcoxon rank‐sum test (A and C) and adjusted using Holm's method (B).