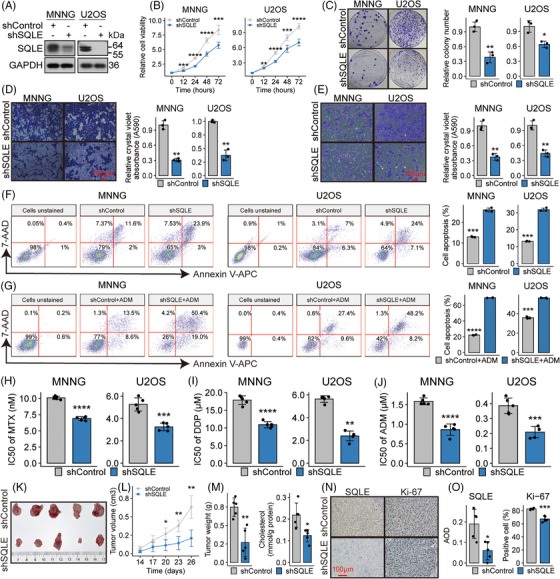
FIGURE 6.

Squalene epoxidase (SQLE) knockdown impedes osteosarcoma (OSA) progression in vitro and in vivo. (A) SQLE protein abundances following transfection of either shSQLE or shControl are depicted via Western blot in labelled cell groups. (B–E) Assays of cellular proliferation (B), clonogenic growth (C), migration (D) and invasion (E) in labelled cell groups. (F and G) Flow cytometric analyses, employing Annexin V‐APC/7‐AAD staining, quantify apoptotic cells in labelled cell groups, either untreated (F) or following adriamycin (ADM) exposure (G). Apoptotic cells exhibit Annexin V‐APC positivity within the right‐top and right‐down quadrants. (H–J) Bar plots contrast the sensitivities of the indicated cell groups to the indicated drugs. (K) Images of isolated tumours from subcutaneous xenograft models established using U2OS cells either harbouring shControl or shSQLE. (L) Tumour growth curves of the indicated groups. (M) Weight and cholesterol levels of tumour masses are presented in bar plots. (N) Representative images of immunohistochemistry for SQLE and Ki‐67 staining in tumours derived from the xenograft model. (O) Bar plots contrast the SQLE abundance and percentage of Ki‐67‐positive cells. AOD: average optical density. *p < .05; **p < .01; ***p < .001; ****p < .0001, by Student's t‐test for bar plots, or Tukey HSD test for cellular proliferation and tumour growth curves.
