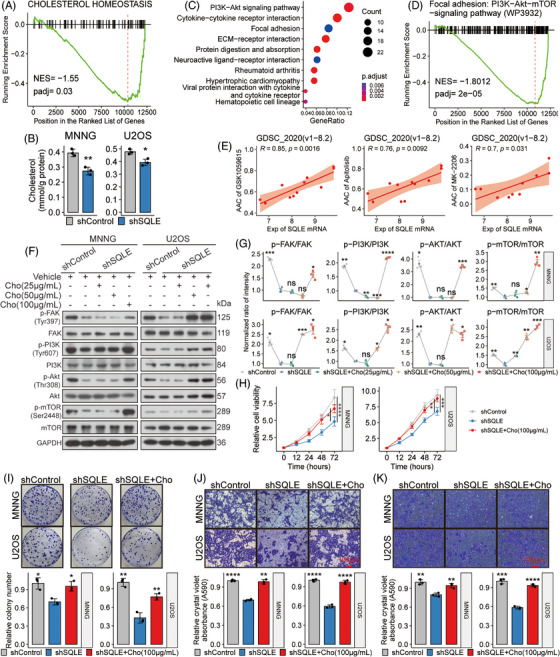
FIGURE 7.

Squalene epoxidase (SQLE) silencing impedes osteosarcoma (OSA) by reducing cholesterol and inhibiting the FAK/PI3K/Akt/mTOR pathway. (A and D) Gene set enrichment analysis (GSEA) plots illustrate enrichment trends for the indicated gene sets. Genes are arranged in descending order based on their log2FoldChange value. (B) The bar graphs show intracellular cholesterol levels in labelled cell groups. (C) KEGG enrichment results of differentially expressed genes (DEGs) are presented in a bubble plot. (E) Scatter plots show correlations between SQLE mRNA levels and area above the dose–response curve (AAC) values of three specific inhibitors targeting the PI3K/mTOR signalling cascade. (F and G) Protein expression profiles in labelled cell groups and subsequent quantifications of these profiles are displayed. (H–K) Experimental outcomes of the indicated cell groups, including cellular proliferation (H), clonogenic potential (I), migration (J) and invasion capabilities (K), are displayed. Cho: Cholesterol. For experiments involving multiple groups, the mean value of the shSQLE group served as a comparative benchmark against other groups. ns: p > .05; *p < .05; **p < .01; ***p < .001; ****p < .0001, by Tukey HSD test for all proliferation curves, or Student's t‐test adjusted using Holm's method for other plots.
