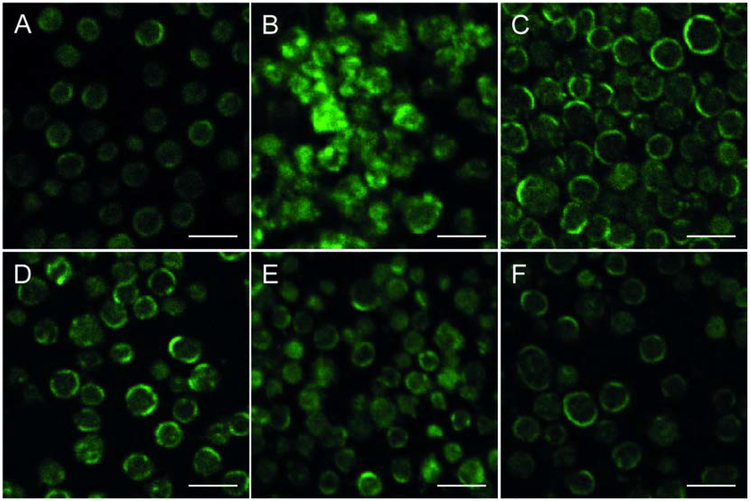
Fig. 4. Representative images of septin 2 distribution in isolated normal human platelets under various experimental conditions as detected by immunofluorescence.
(A) Control (untreated) platelets. (B-F) Platelets incubated with: anti-dsDNA Ab/dsDNA complexes (B), anti-dsDNA Ab/dsDNA complexes after pre-treatment with anti-FcγRIIA mAb (C), dsDNA (D), anti-dsDNA Abs (E), and anti-dsDNA Abs after pre-treatment with anti-FcγRIIA mAb (F) In A, C, D, and F, platelets display homogeneous intracellular distribution of septin 2 with a prevalent concentration at the cell periphery. In B, septin 2 forms multiple fluorescent clusters mostly at the cell periphery as well as in the middle of platelet bodies. In E, platelets contain clusters of septin 2 with prevailing concentration at the cell periphery, albeit with moderate clustering and cytoplasmic spreading. All the images were acquired with the same microscope settings. Scale bar = 5 μm.

