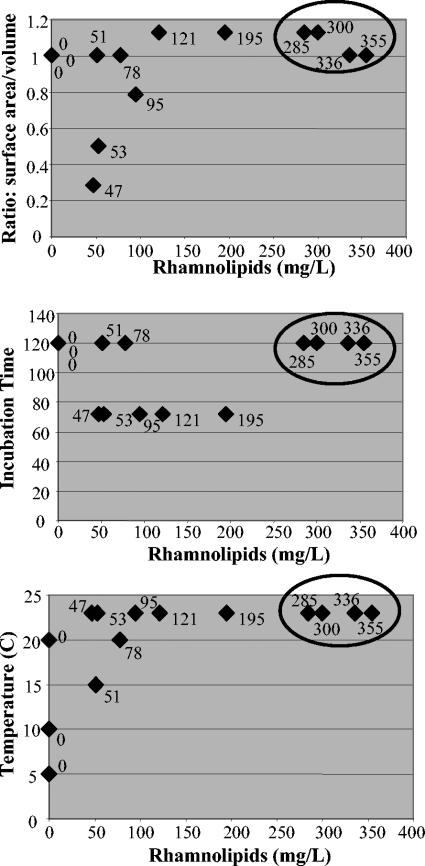
FIG. 3.
A comparison of the three growth conditions (temperature, incubation time [hours], and surface area to medium volume ratio in flask) and their effects on rhamnolipid production. The positions of the top four rhamnolipid-producing cultures are circled for easy comparison in each of the three graphs. The amount of rhamnolipid produced (milligrams/liter) for each sample is noted beside the respective datum point.

