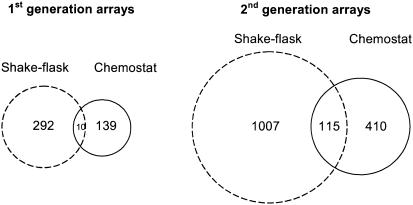
FIG. 3.
Venn diagrams showing the number of sequences with increased expression when the parental and recombinant protein-producing strains in shake flask and chemostat cultures are compared. The circle area is proportional to the number of sequences. ESTs and PCR products from the first-generation arrays are also included on the second-generation arrays. Gene lists are available at http://www.cogeme.man.ac.uk.

