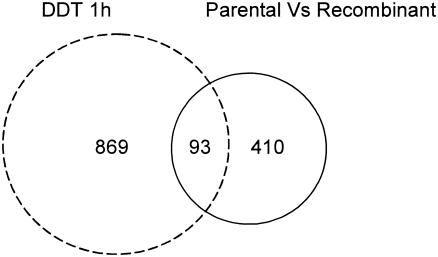
FIG. 4.
Venn diagrams showing the number of up-regulated spots when different approaches for induction of UPR are compared using the G2 array. The circle area is proportional to the number of spots. Gene lists are available at http://www.cogeme.man.ac.uk.

