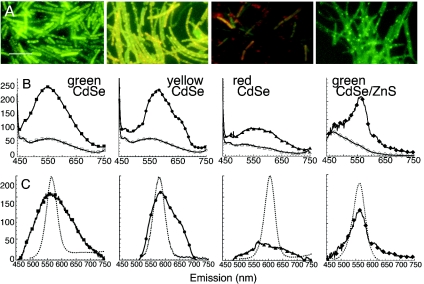
FIG. 2.
Fluorescent labeling with four distinct colors of QD-adenine conjugates. All spectra are averages of at least three independent experiments, with error bars smaller than the symbols. All epifluorescence images were taken with the same gain and exposure time. Scale bar, 10 μm. (A) Epifluorescence images of green CdSe, yellow CdSe, red CdSe, and green CdSe/ZnS QD-adenine conjugates after 3 h of incubation with wild-type B. subtilis in LB culture medium. Labeling with green and yellow CdSe QDs is very strong and is broadened from the original QD color; labeling is strongest at the cell poles but is not restricted there. Labeling with red CdSe QDs is nearly absent. Labeling with CdSe/ZnS QDs shows no fluorescence broadening and a greater restriction to the cell poles. (B) Raw (not normalized or background-subtracted) emission spectra of the cultures in A (solid symbols) shown with autofluorescence spectra (open symbols). Autofluorescence was not significantly different between killed bacteria exposed to QDs and live bacteria without QDs; the size of the symbols represents the standard error of the observed variation. (C) Spectra after background subtraction. The spectra of the QD-only controls is included for comparison (▪▪▪▪▪). Green CdSe-adenine-B. subtilis (▪) yields a spectrum centered around the peak of the original QD-adenine (dashed line) but with a full width at half maximum (FWHM) broadened from 44 to 100 nm (Gaussian fit, R > 0.999). The spectrum of yellow CdSe-adenine-B. subtilis (•) also retains the original peak (dashed line) and is broadened slightly less than that of green (FWHM,80 nm; Gaussian fit, R > 0.99) but with a significant red tail. The spectrum of red CdSe-adenine-B. subtilis (▴) shows no real peak. The spectrum of green CdSe/ZnS (♦) is not significantly broadened and overlaps the QD-control spectrum almost perfectly.

