FIG. 5.
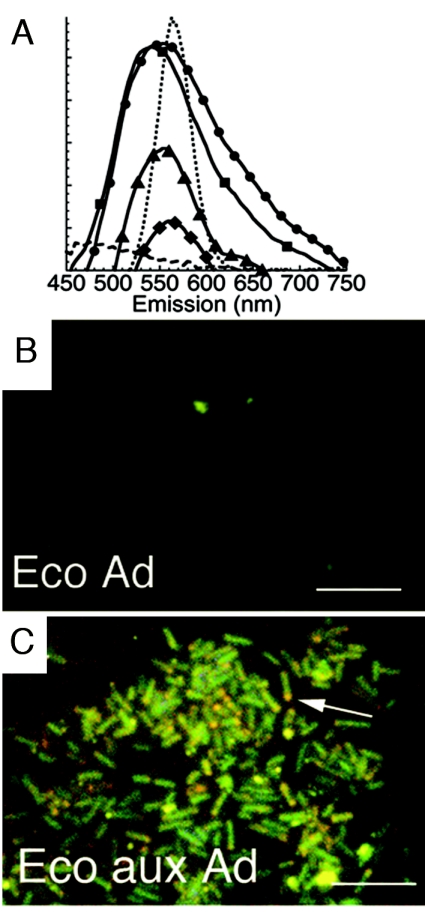
Fluorescent labeling of E. coli with QD-adenine and QD-AMP. Scale bar, 5 μm. (A) Fluorescence spectra (arbitrary units) after 1 h of incubation of the adenine auxotrophic mutant with QD-adenine (•) and QD-AMP (▪), the wild type with QD-adenine (▴) and QD-AMP (♦), and the heat-killed auxotroph with QD-adenine () (n > 3; error bars smaller than symbols). The spectrum of the original QDs is included for comparison (dotted line). (B) Wild type incubated with QD-adenine (Ad) for 30 min in minimal growth medium. (C) Adenine auxotroph (aux Ad) under the same conditions; note red shifts at cell poles (arrow).

