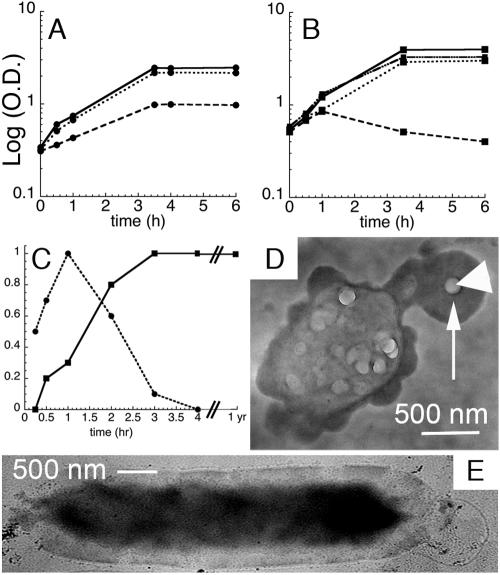
FIG. 6.
Effects of QD labeling on growth and survival (n > 3 for all data points; error bars smaller than symbols). (A) Growth curves for the B. subtilis apt mutant at 37°C, showing a log of optical density at 600 nm versus time in h for incubations with no QDs (———), QDs that show strong cell-associated fluorescence (QD-AMP (), and QDs that do not show significant cell fluorescence (QD-AMP with PEG-5000 [•••••]). (B) Growth curves for adenine auxotrophic E. coli at 37°C in LB medium with no QDs (———), in minimal medium with no QDs (−/B), in minimal medium with QD-AMP (•••••), and in minimal medium with QD-AMP-PEG (—•••-). Growth curves were begun at mid-log phase to reflect optimal time for QD addition. (C) Relative fluorescence intensity at peak compared to incubation time for B. subtilis (▪) and E. coli (•). (D) Whole-mount TEM of an E. coli cell after 4 h of incubation with QD-adenine. EDS values within the dark area (arrow) were 14 atomic% ± 4 atomic% Cd and 9% ± 2% Se (n = 100); the large particle (arrowhead) contained negligible Cd and Se. (E) Whole-mount TEM of a QD-adenine-labeled B. subtilis cell after 1 year at 4°C, showing internal electron-dense material (14 atomic% ± 2 atomic% Cd, 8% ± 1% Se; n = 60) and an absence of sporulation. (Unlabeled controls are nearly invisible [not shown].) (a Cd/Se ratio between 1.2 and 2.4 is consistent with whole QDs [Fig. 8]). Note the presence of many QD aggregates after this long period of storage; this is typical for QDs stored in the presence of water.

