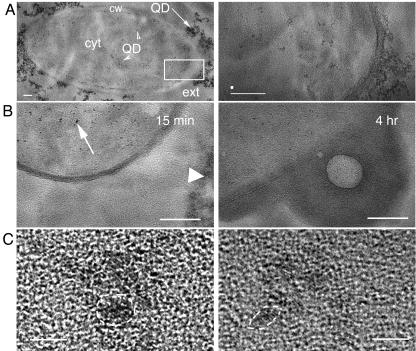
FIG. 7.
TEM images of QDs in embedded ultrathin sections. (A) Transverse thin section of the B. subtilis ade mutant incubated with yellow QD-AMP. Scale bar, 100 nm. Left, low resolution showing QDs inside and outside the cell. Visible are the cell wall (cw), cytoplasm (cyt), and cell exterior (ext). QDs are seen outside the cell (arrow) and inside the cytoplasm (arrowheads). The boxed area is shown in close-up on the right, where distinct particles are clearly visible inside the cytoplasm. EDS values from these particles are given in Results; the white spot above the scale bar shows the size of the EDS beam. (B) Transverse thin section of E. coli auxotroph incubated with QD-AMP. Scale bar, 100 nm. Left, cultures incubated for 15 min, showing many QDs inside the cell (arrow) as well as remaining outside (arrowhead). Right, cultures incubated with QD for 4 h, showing expulsion. (C) High resolution of QDs within thin sections of B. subtilis. Scale bar, 5 nm. Although the thickness of the thin sections does not permit sufficient resolution for quantitative analysis of particle size, the QD lattice structure can be visualized, confirming that the particles are QDs (examples encircled by dashed lines).

