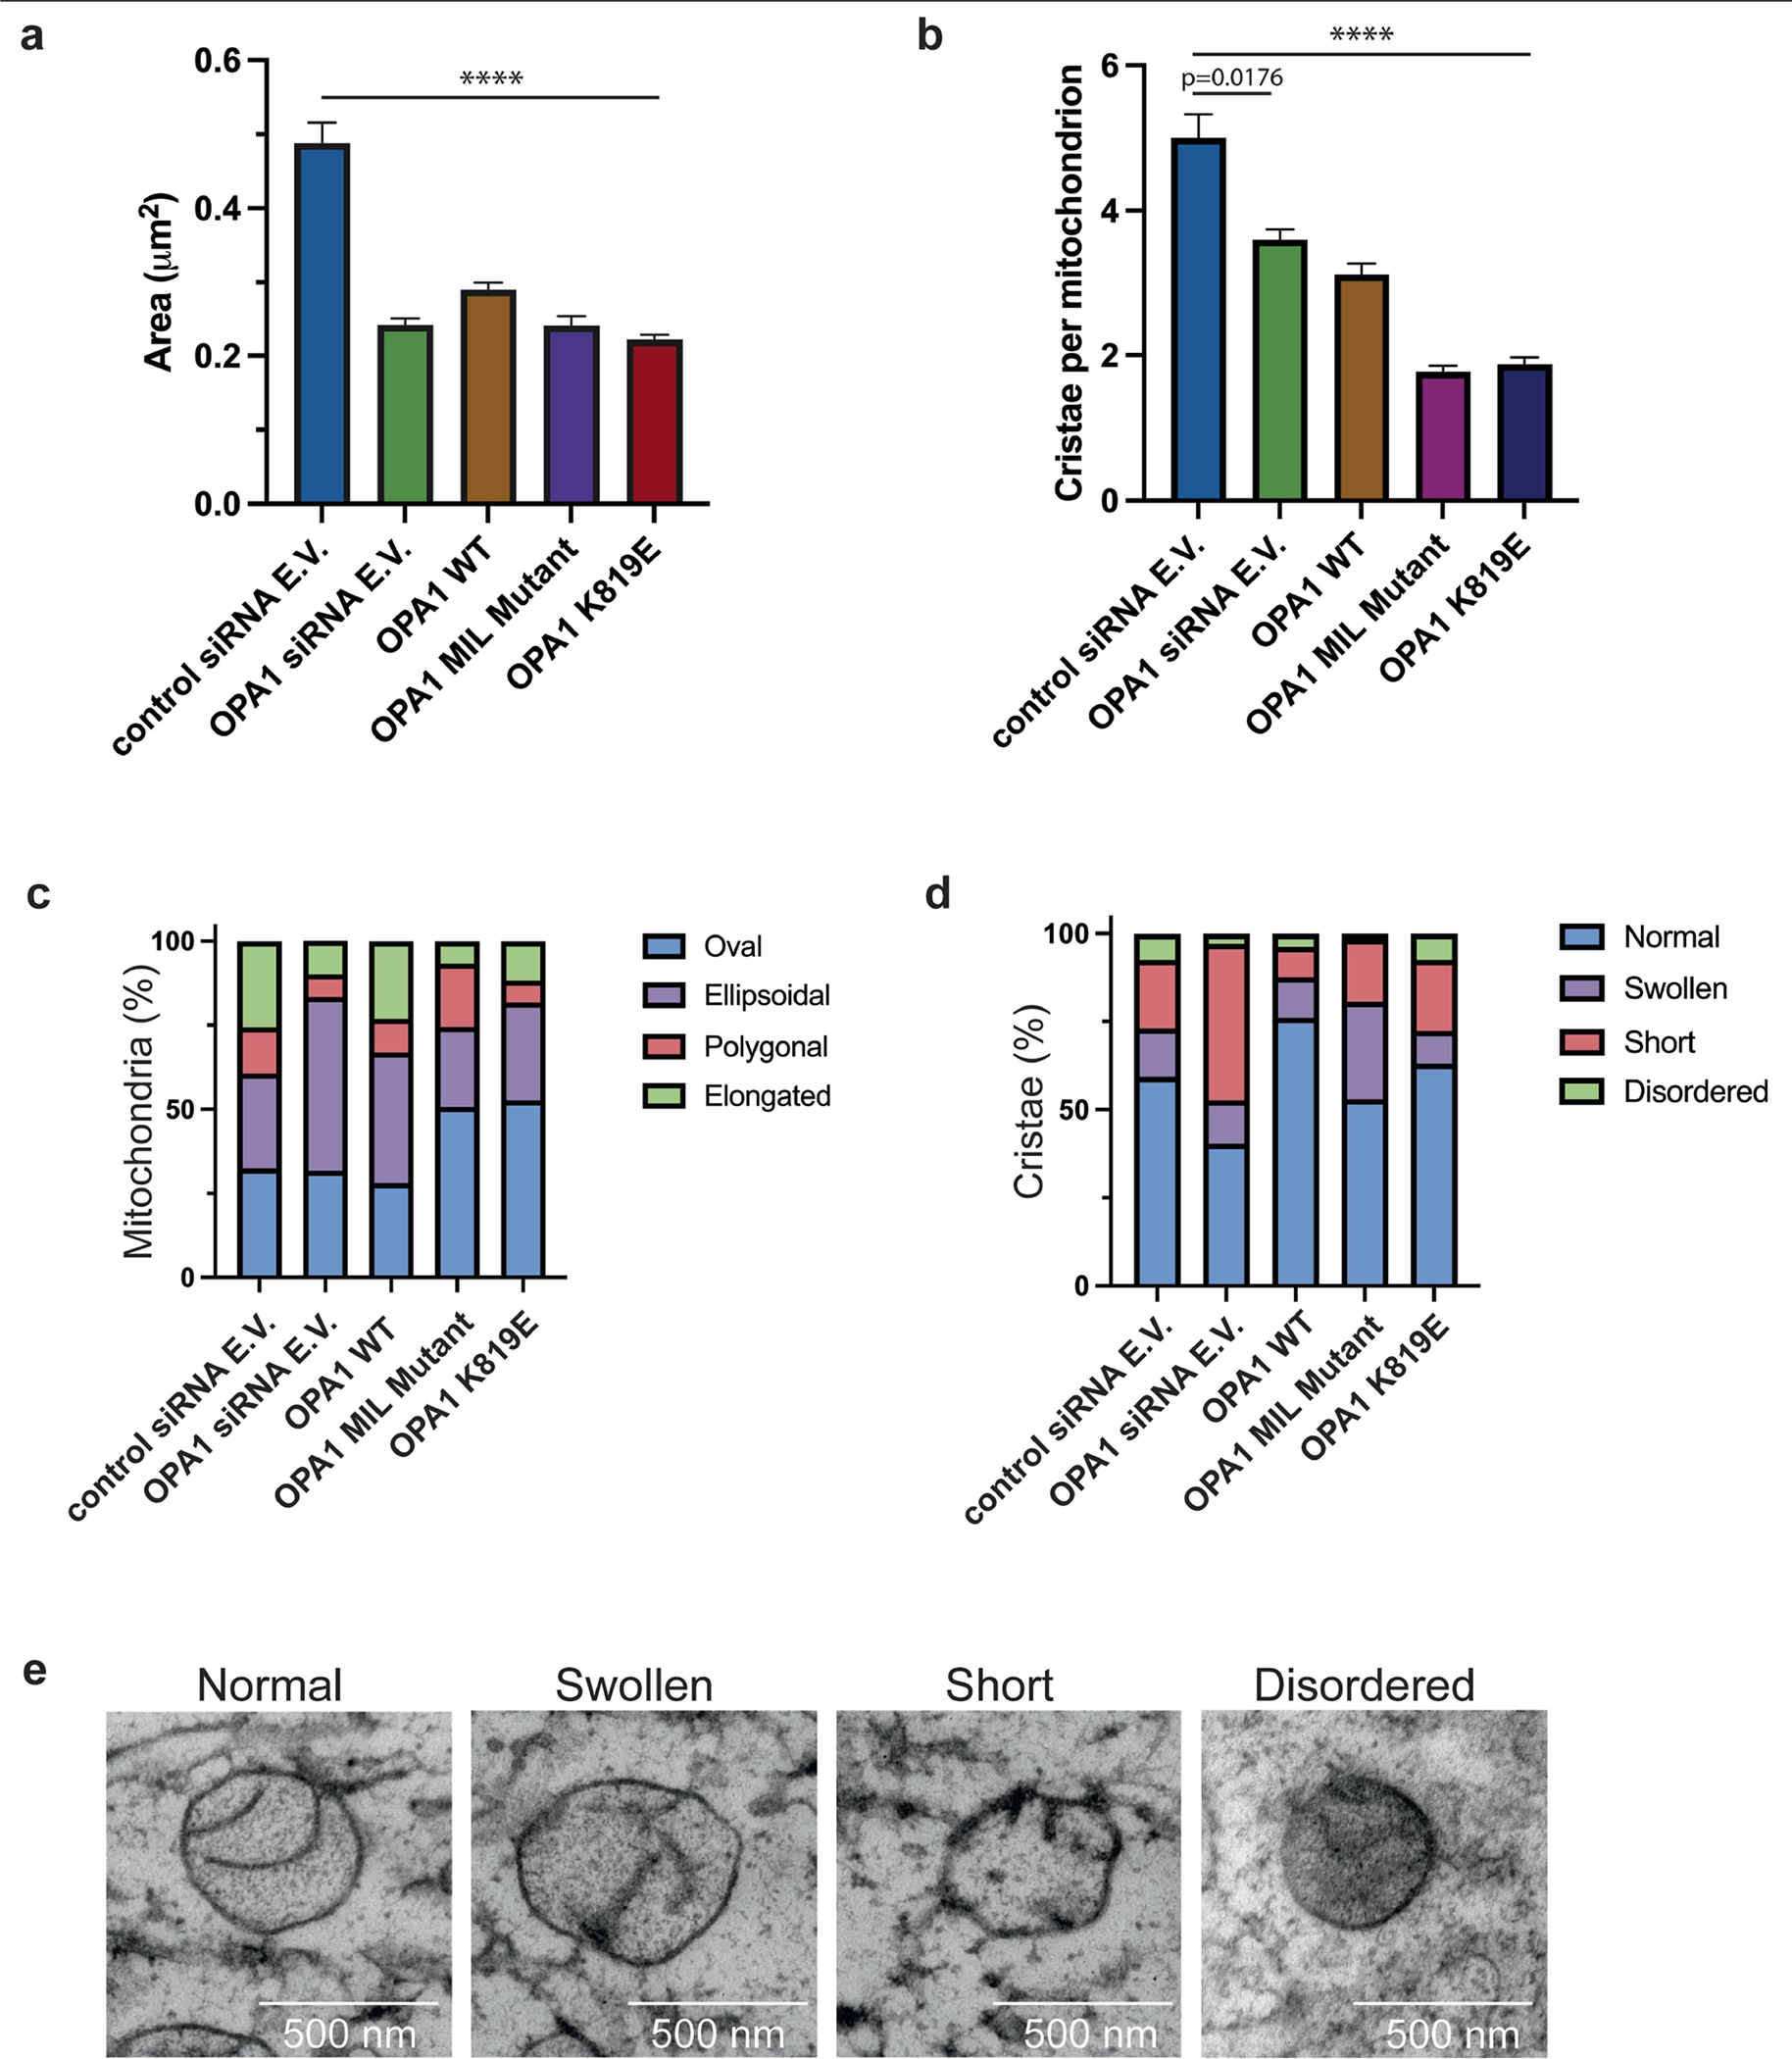
Extended Data Fig. 9 |. OPA1 Mutations disrupt cristae architecture and overall mitochondrial morphology as compared to the WT.

a, Mitochondrial surface area (μm2) was calculated from ultrathin sections of cells transfected with control siRNA empty vector (E.V.) (n = 312), OPA1 siRNA E.V. (n = 444), OPA1 WT (n = 543), OPA1 membrane-inserting loop (MIL) mutant (n = 523), and OPA1 K819E (n = 516). The standard error of the mean is reported with the mean of each dataset (n = 3 technical triplicates). Due to the variation in numbers for each dataset, two-tailed Mann-Whitney statistical test was utilized to calculate the statistical significance between control siRNA E.V. to each other sample. P < 0.0001 (****). b, Quantification of the number of cristae per mitochondrion. The mean number of cristae was calculated and reported with the standard error of the mean for each sample (n = 3 technical triplicates). The control siRNA E.V. and other samples were subjected to a two-tailed Mann-Whitney test to determine the statistical significance. P = 0.0176 (*); P < 0.0001 (****). c, Quantification of the mitochondrial morphology in WT and mutant OPA1 cells. The mitochondrial shape was assigned to four different classes, oval, ellipsoidal, polygonal, or elongated, and the relative distribution of each shape was reported as a bar graph. The percentage of each shape is reported for each sample. d, Quantification of cristae morphology in WT and mutant OPA1 cells. A bar graph representing the distribution of four different cristae morphology (normal, swollen, short, or disordered) observed in respective samples as percentages. e, Representative TEM images of the mitochondrion showing different types of cristae morphology assigned to four classes: normal, swollen, short, and disordered. Images were taken in technical triplicate. Scale bar, 500 nm.
