Figure 1.
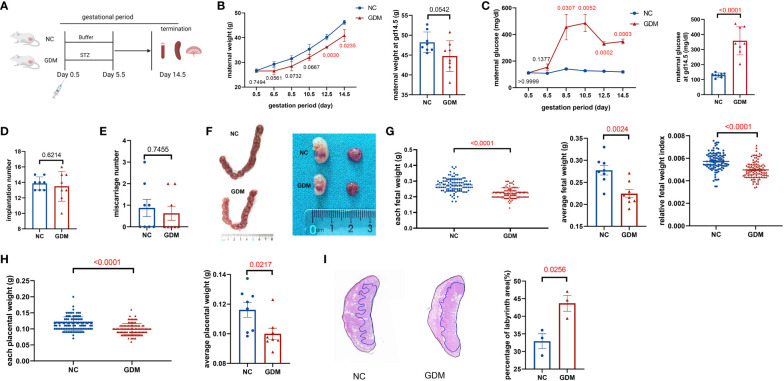
Experimental protocol for GDM mouse models and the pregnancy outcomes of normal and GDM mouse models. (A) Schematic diagram showing the experimental design of the mouse model establishment. Mice were killed on day 14.5 after mating, pregnancy outcomes were observed and immune cells were isolated and analyzed. (B) Maternal weight and (C) blood glucose in normal pregnancy or GDM pregnancy were measured during gestation (dams: n=3 each group) and at GD14.5 (dams: n=8 each group). All dams were killed on GD14.5, (D) the implantation numbers and (E) miscarriage numbers were presented. (F) Representative picture of uterus and fetuses from normal pregnancy and GDM pregnancy at GD14.5. (G) Each fetal weight, average fetal weight of each GDM dam and relative fetal weight index (fetal weight/maternal weight) was significantly decreased than normal dam, as well as (H) each placental weight and average placental weight of each GDM dam. Fetus: n=103 in normal pregnant group, n=104 in GDM pregnant group, dams: n=8 each group. (I) Representative picture of placental HE staining in NC and GDM dams, the proportion of labyrinth area of GMD was significantly higher than that in NC group, dams: n=3 each group. Data are presented as mean ± SEM. Mann-Whitney U tests were used for comparison of miscarriage number, each fetal weight, and each placental weight, and Student’s t-tests were used to calculate other values. (Figure A was created with Biorender.com).

