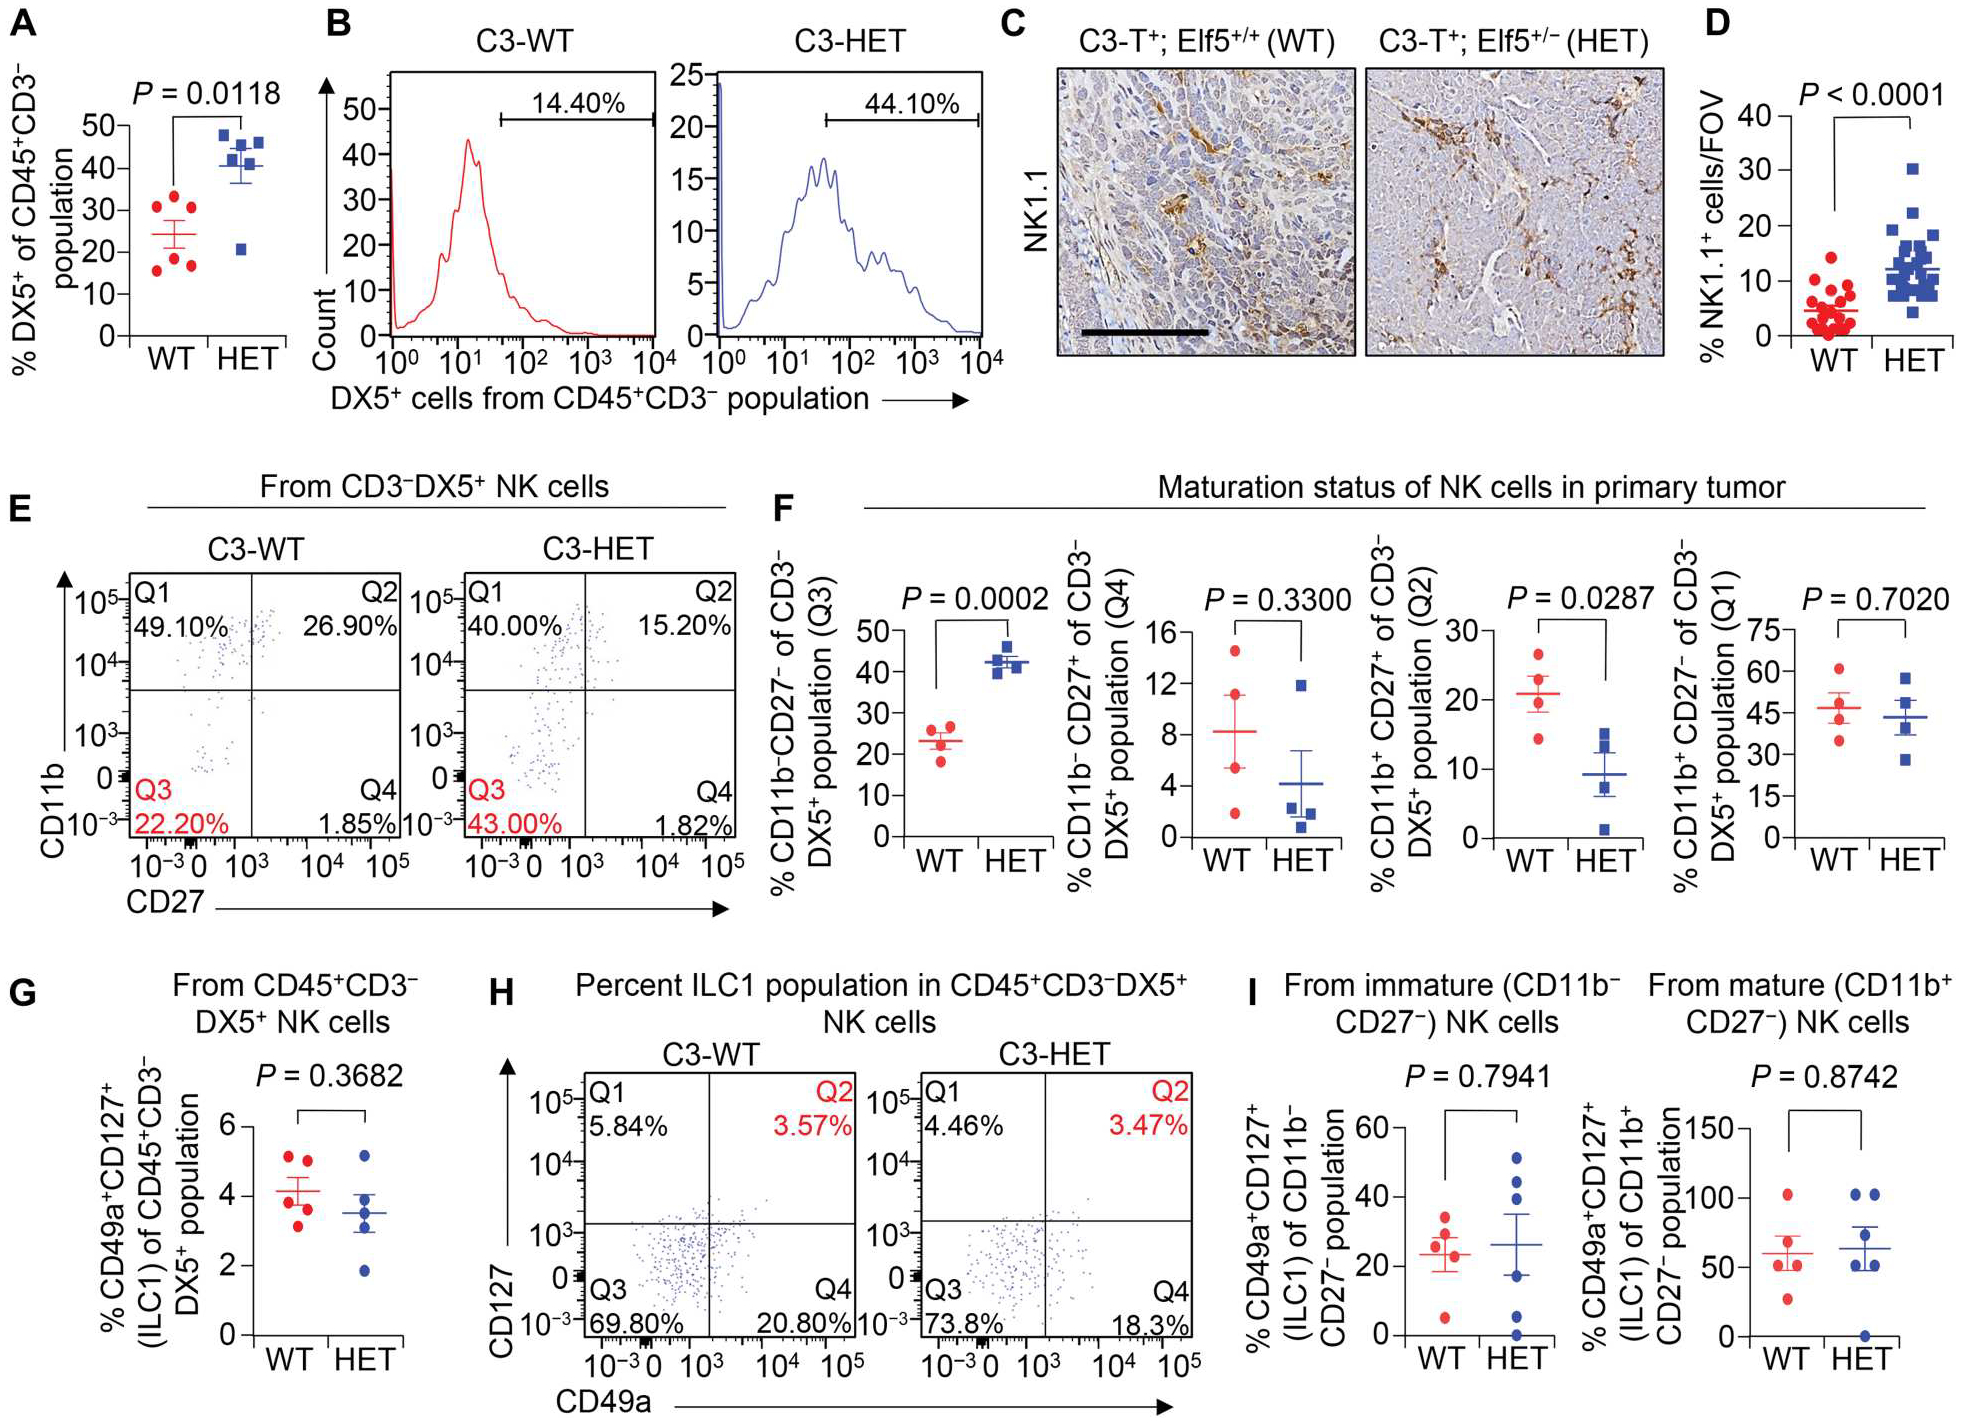
Fig. 2. TNBC-associated NK cells are immature.

(A and B) Shown are the percentages of CD45+CD3−DX5+ NK cells of CD45+CD3− cells (A) and representative flow cytometry plots (B) in primary tumors of indicated groups. (C and D) Representative IHC staining (C) and quantification (D) of NK1.1+ cells in C3-HET and C3-WT primary tumors. n = 4 tumors for C3-WT and n = 5 tumors for C3-HET were used, with analysis of n = 19 random fields from C3-WT tumors and n = 29 random fields from C3-HET tumors for quantification. Scale bar, 100 μm. FOV, field of view. (E and F) Flow cytometry plots (E) and scatterplots (F) show comparison of NK cell subpopulations based on CD27 and CD11b expression in tumors from C3-HET and C3-WT mice. Percentages are of the total NK cell population. Q3 represents the immature NK cell population. (G) Flow cytometry analysis shows the percentage of ILC1 cells (CD45+CD3−DX5+CD49a+CD127+) between C3-WT and C3-HET tumors. (H) Representative flow cytometry plots show percentage of CD127+CD49a+ ILC1s gated from CD45+CD3−DX5+ NK cells of the indicated groups. Q2 represents the ILC1 gate. (I) Scatterplots show percentage of the CD127+CD49a+ ILC1 population gated either from CD11b−CD27− immature (left) or CD11b+CD27− mature (right) NK cells between C3-WT and C3-HET tumors. The scatterplots show the number per group of samples from flow analysis, and data are presented as means ± SEM. Statistical significance was determined by two-tailed Student’s t test.
