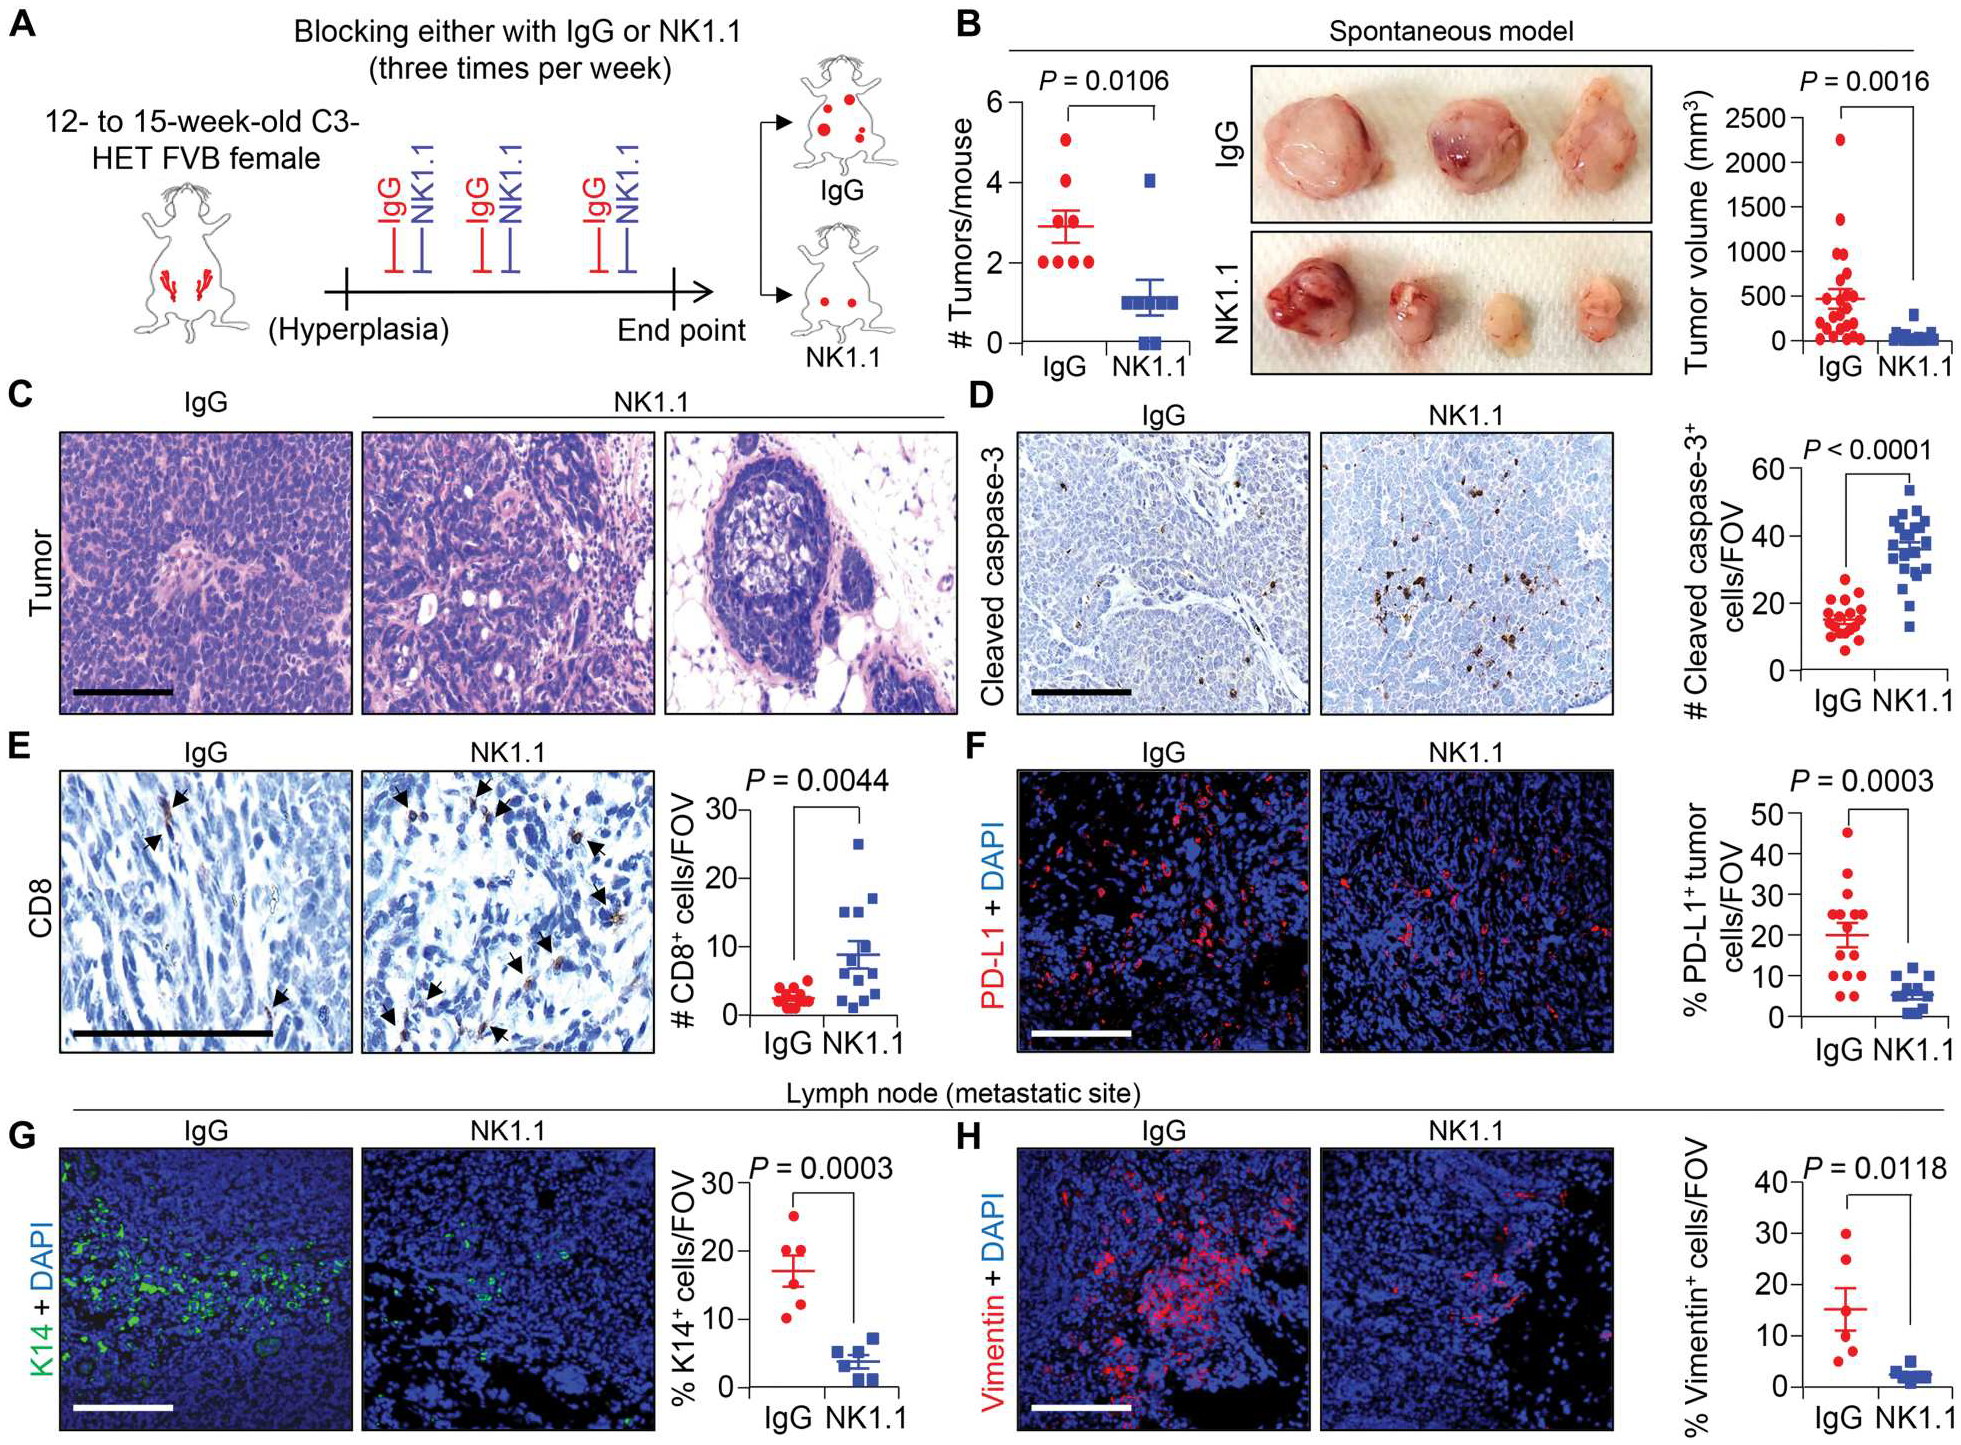
Fig. 3. Spontaneous TNBC tumors have higher NK cell infiltration, and depletion of NK cells reduced tumor progression.

(A) The schematic shows the experimental approach for NK cell depletion in the spontaneous C3-HET murine model. Twelve- to 15-week-old female mice with hyperplasia of mammary gland received anti-NK1.1 or isotype control immunoglobulin G (IgG) antibodies three times per week, and tumor growth was measured until humane end point for analysis. (B) Tumor burden per mouse (left; n = 8 mice per group), representative tumor images (middle), and calculated tumor volume (right), V = ½ (length × width2) upon NK cell depletion in C3-HET mice. (C) Hematoxylin and eosin–stained images of primary tumors upon NK cell depletion compared with IgG control group. (D) Cleaved caspase-3 staining (left) and quantification (right) of apoptotic cells in primary tumors upon NK cell depletion (n = 3 individual tumors per group, with analysis of n = 18 random fields from IgG tumors and n = 22 random fields from NK1.1-depleted tumors for quantification). (E) Immunostaining of cytotoxic CD8+ T cells in tumors from NK cell–depleted mice (arrowheads indicate positive staining; left) with quantification on the right (n = 3 individual tumors per group and n = 13 random fields per group). (F) Representative immunofluorescence (IF) images show expression of PD-L1+ primary tumor cells (red) upon NK cell depletion. Scatterplots (right) represent quantification (n = 3 individual tumors per group, n = 15 random fields from IgG tumors, and n = 12 random fields from NK1.1-depleted tumor for quantification). (G and H) Representative IF images (left) and quantification (right) show K14+ tumor cells (green) (G) and Vimentin+ cells (red) (H) in the axillary lymph node upon NK cell depletion (n = 5 individual lymph nodes). Two-tailed Student’s t test was used to compute P values. Data are presented as the mean ± SEM. Scale bars, 100 μm. DAPI, 4′,6-diamidino-2-phenylindole.
