
Fig. 4. Pharmacological depletion of NK cells reduces tumor growth, progression, and metastasis in murine TNBC.
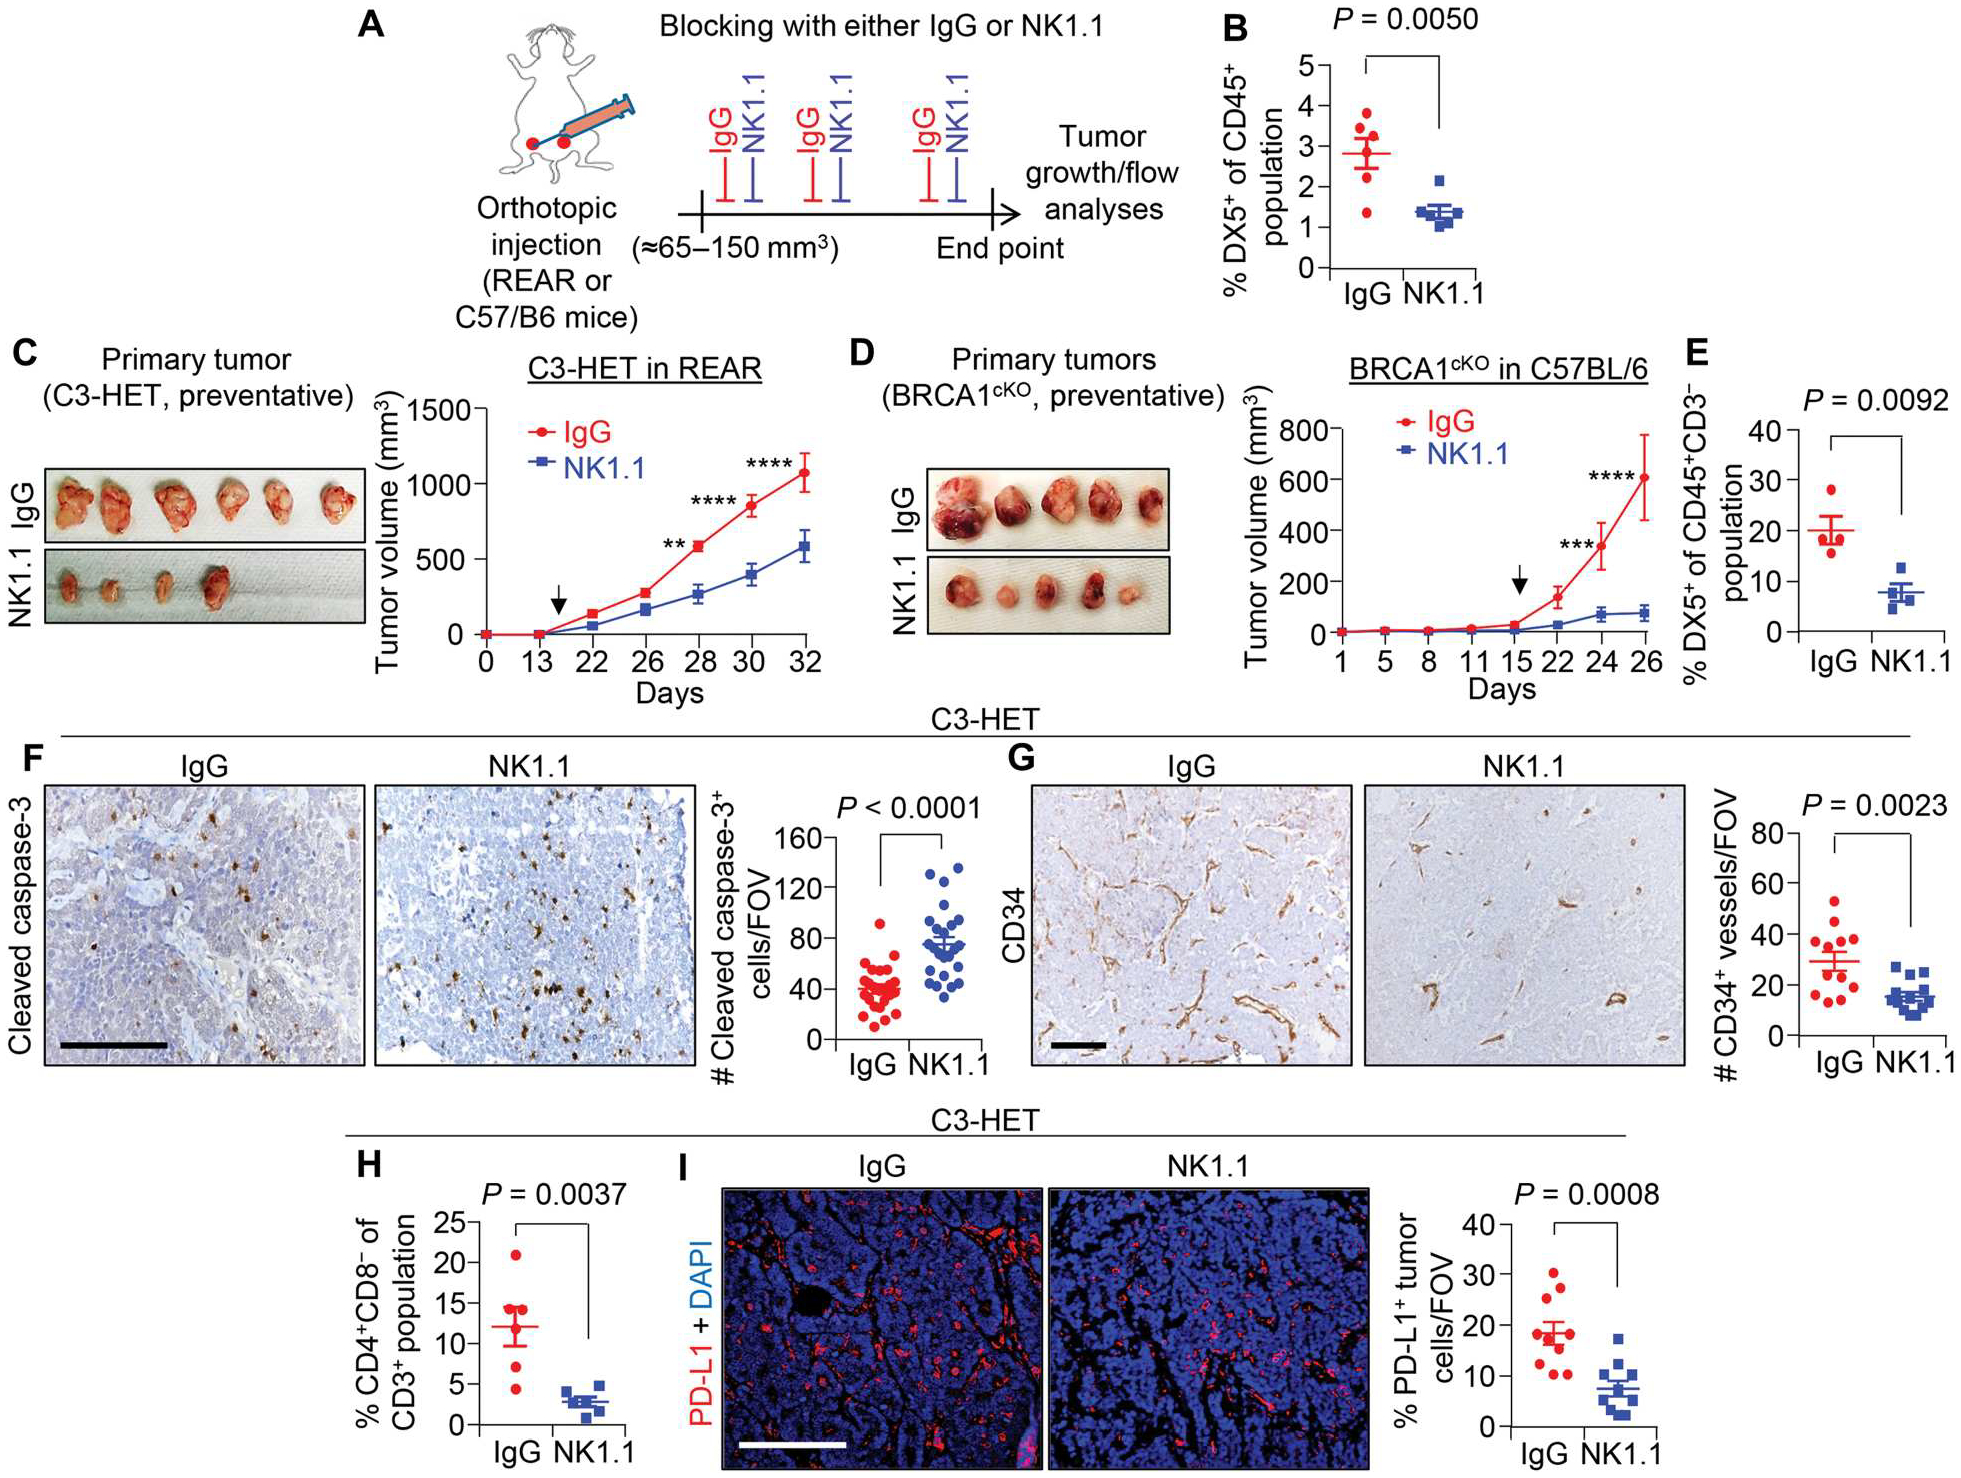
(A) Schematic shows experimental approach of NK cell depletion for preventative (large tumor) setting. A total of 140,000 primary tumor cells from C3-HET mice were injected into the mammary fat pads (MFPs) of REAR mice. (B) Percentage of NK cells (CD45+DX5+) of CD45+ cells in C3-HET primary tumors upon anti-NK1.1 treatment compared with control tumors. (C) Representative images of tumors (left) and tumor growth curve (right) upon NK cell depletion in the preventative setting (n = 8 tumors per group). (D) Representative tumor images (left) and tumor growth curve (right) showing tumor progression for BRCA1cKO tumor–bearing mice (n = 6 tumors for IgG and n = 8 tumors for NK1.1). A total of 125,000 primary tumor cells per MFP from BRCA1cKO mice were injected into C57BL/6 mice. Arrowheads in (C) and (D) indicate the start point for drug dose. (E) Percentage of NK cells (CD45+CD3−DX5+) of CD45+CD3− cells in primary BRCA1cKO tumors upon NK cell depletion compared with control tumors. (F) Cleaved caspase-3 staining (left) and quantification (right) show apoptotic cells in primary tumors upon NK cell depletion (n = 3 individual tumors per group and n = 24 random fields per group for quantification). (G) Representative IHC images (right) and quantification (left) show CD34+ blood vessels in NK cell–depleted primary tumors (n = 4 individual tumors for control and n = 3 for NK cell depletion, with analysis of n = 12 random fields from IgG tumors and n = 13 random fields from NK1.1-depleted tumors for quantification). (H) Flow cytometry analysis showing percentage of CD4+CD8− T cells of CD3+ T cells in primary C3-HET tumors upon NK cell depletion compared with control tumors. (I) IF staining (left) and quantification (right) of PD-L1 in primary tumors upon NK cell depletion (n = 4 individual tumors, with analysis of n = 10 random fields per group for quantification). The scatterplots show the number per group of samples from flow analysis. Two-tailed Student’s t test was used to compute P values for all scatterplots. Data are presented as the mean ± SEM. Statistical significance was determined by two-way ANOVA with Sidak’s multiple comparisons test in (C), (D), and (F). **P = 0.0011, ***P = 0.0003, and ****P < 0.0001. Scale bars, 100 μm.