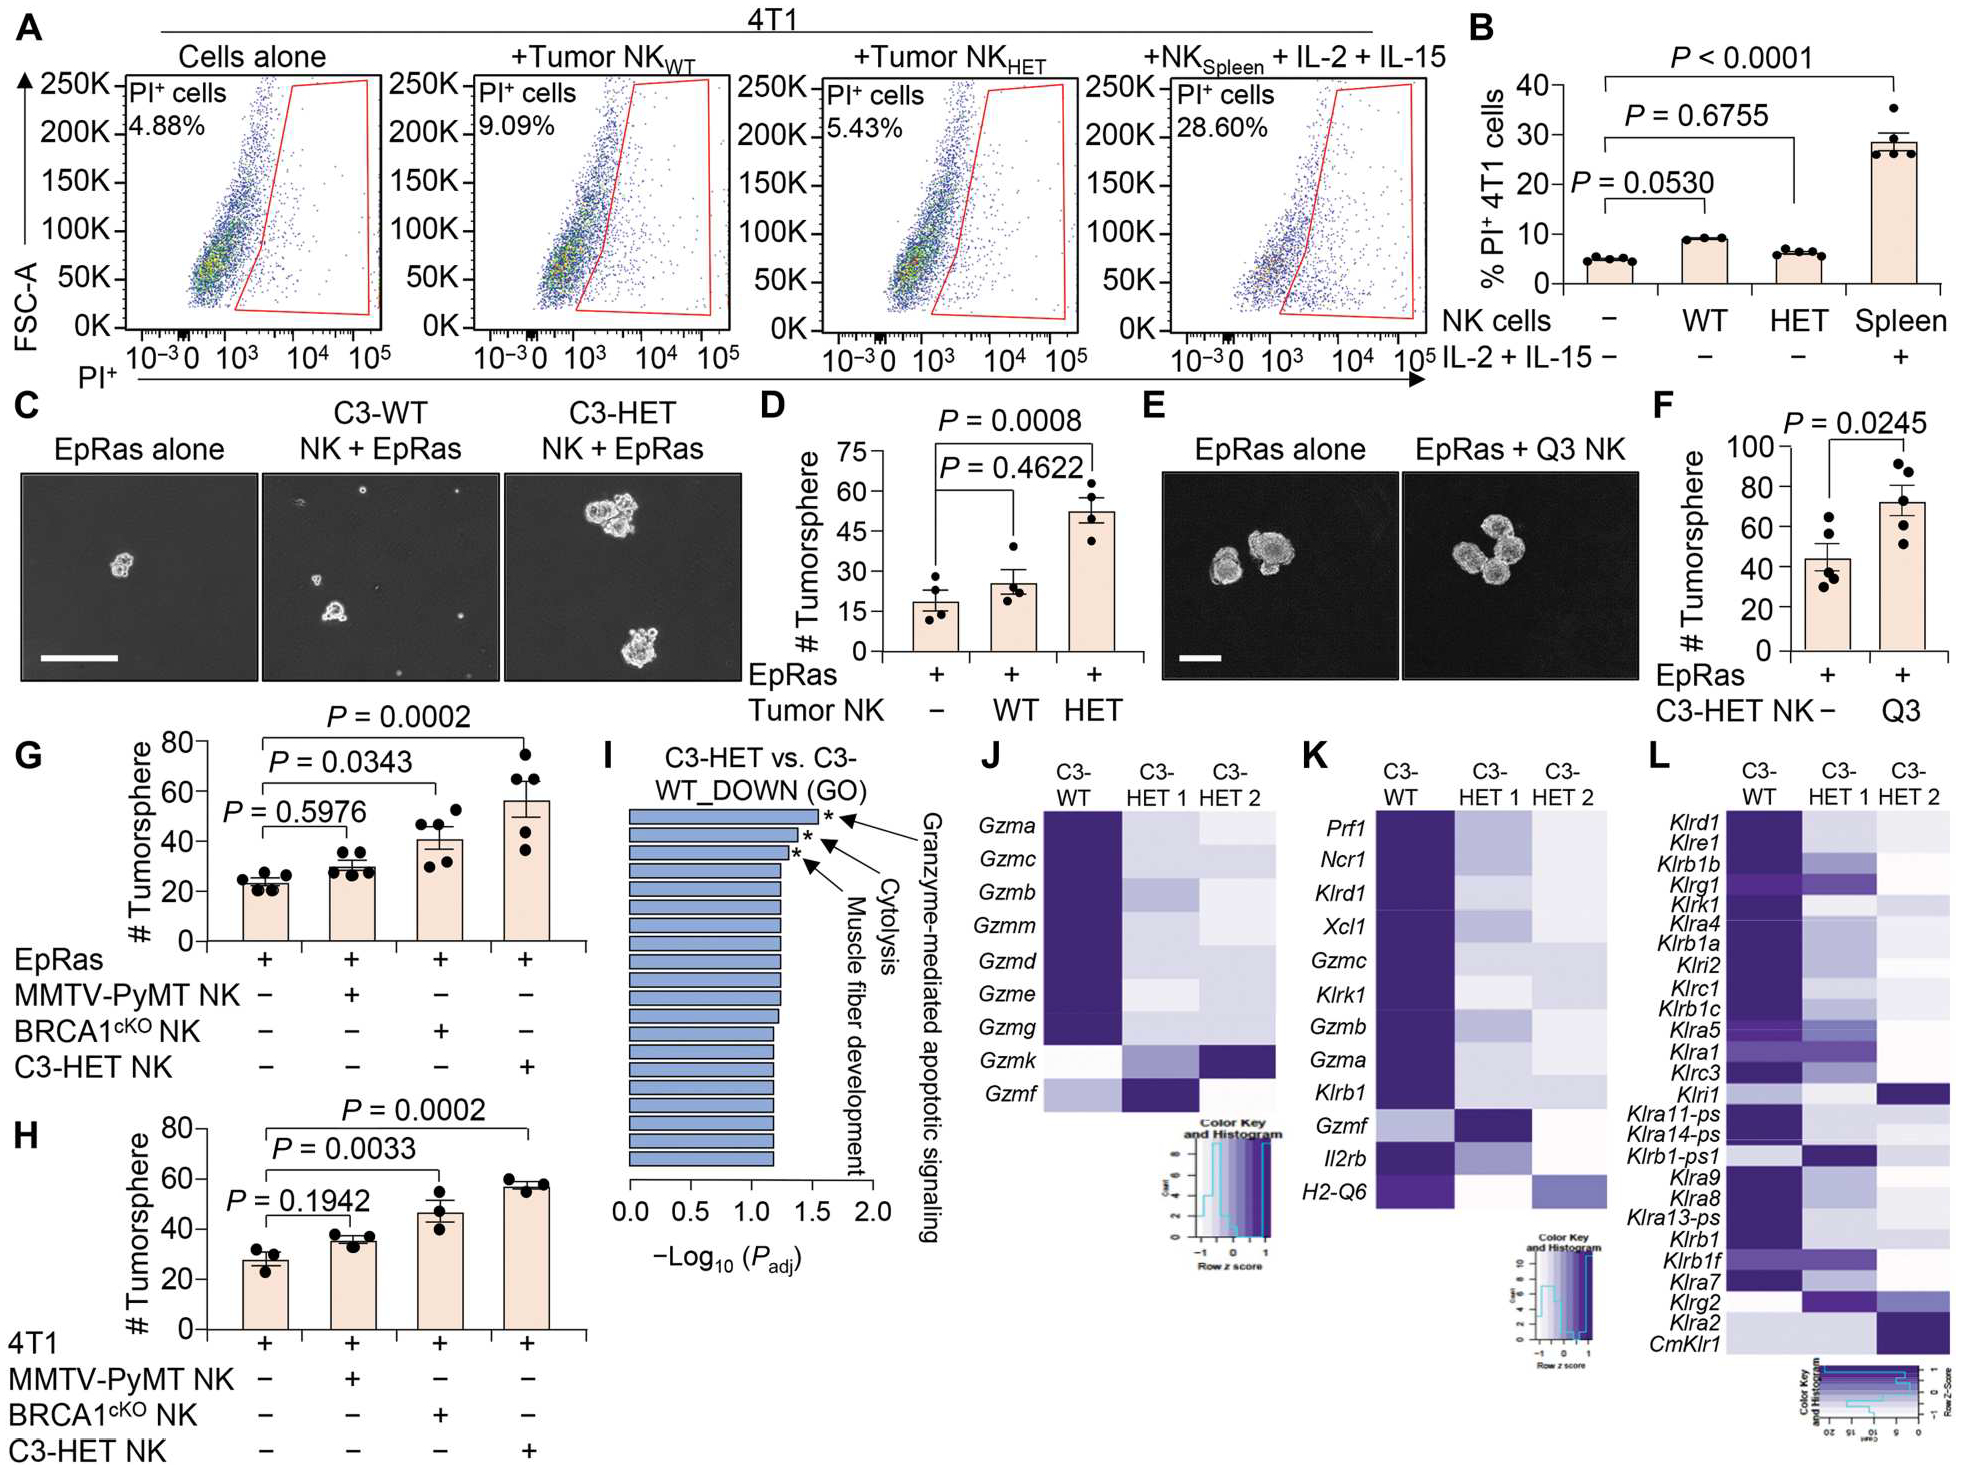
Fig. 5. NK cells from C3-HET tumors are less cytotoxic.

(A and B) Flow cytometry plots (A) and quantification (B) show the viability of 4T1 cells when cocultured with NK cells (CD45+CD3−DX5+) sorted from C3-WT and C3-HET tumors. Coculture with activated spleen NK cells (supplemented with IL-2 and IL-15) from non–tumor-bearing mice were used as control. FSC-A, forward scatter area; PI, propidium iodide. (C and D) Representative images (C) and number (D) of TNBC (EpRas)–derived tumorspheres are shown after coculture with tumor-associated NK cells isolated from the indicated groups. (E and F) Representative images (E) and quantification (F) of tumorspheres are shown for EpRas cells cultured for 3 days with or without sorted immature NK cells (Q3: DX5+CD11b−CD27−) from C3-HET tumors. (G and H) EpRas (G) and 4T1 (H) tumorsphere count is shown after coculture with NK cells isolated from indicated tumors. (I) Gene ontology (GO) enrichment analysis showing most significantly down-regulated pathways in NK cells sorted from C3-HET as compared with C3-WT tumors. Padj, adjusted P value. (J to L) Heatmap from bulk mRNA-seq showing expression of various granzymes (J), genes characteristic of cytotoxic NK cells (K), and killer cell lectin-like receptors (L) in NK cells sorted from C3-HET (n = 2 samples but pooled from several tumors) as compared with C3-WT (n = 1 sample but pooled from several tumors) tumors. Statistical significance was determined by one-way ANOVA with Dunnett’s multiple comparisons test in (B), (D), (G), and (H). Two-tailed Student’s t test was used to determine significance in (F). Data are presented as means ± SEM. Scale bars, 100 μm.
