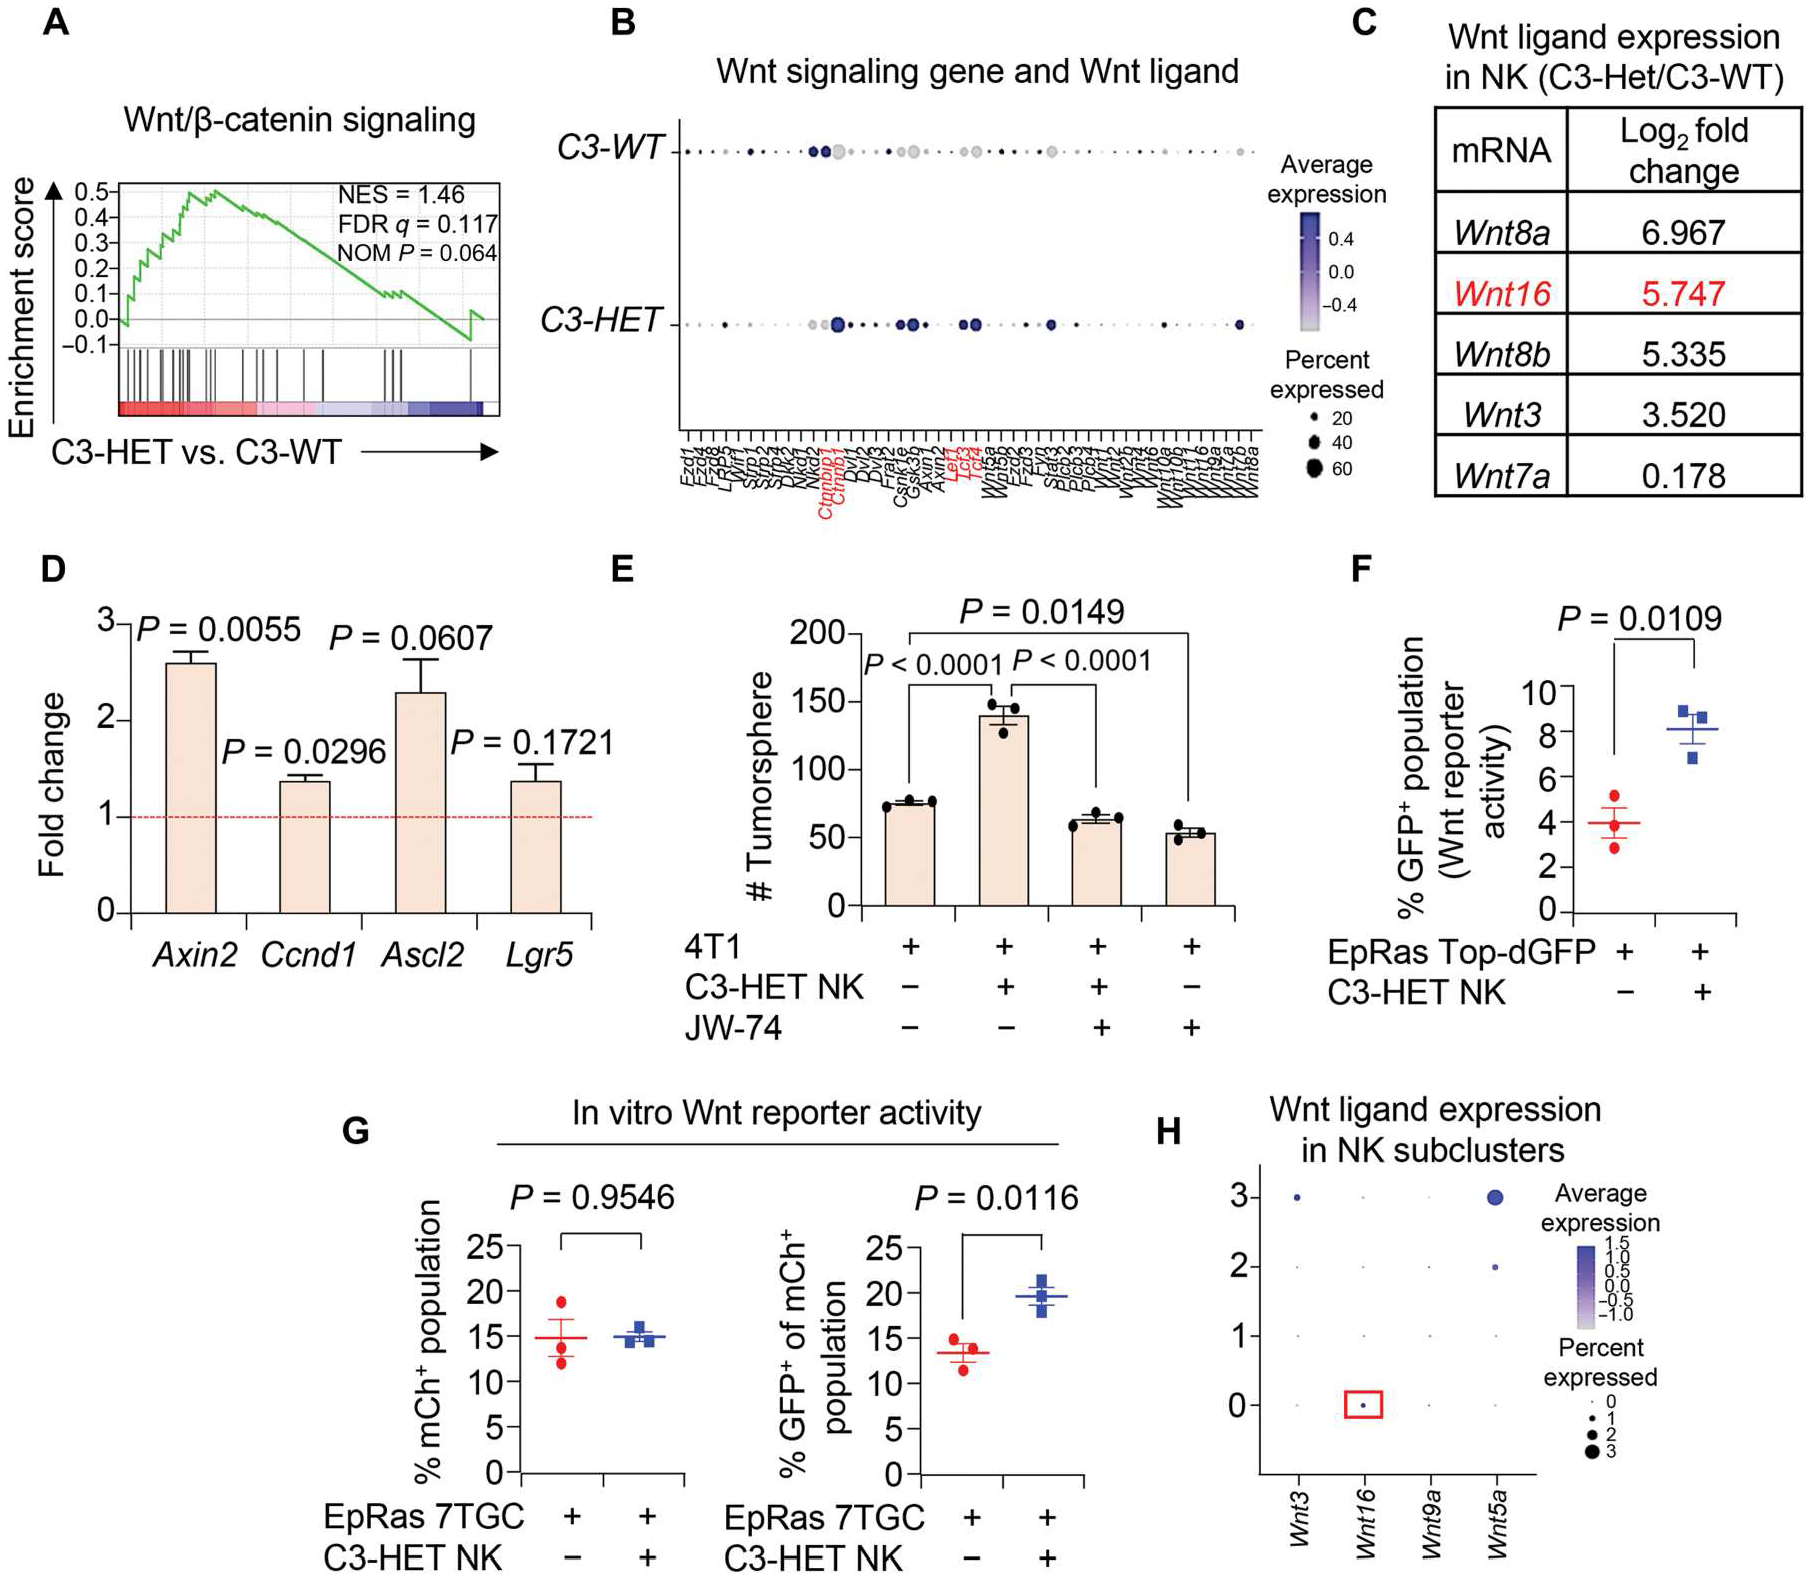
Fig. 6. NK cells in TME of aggressive TNBC secrete Wnt ligands and activate Wnt signaling in tumor cells.

(A) Gene set enrichment analysis (GSEA) from scRNA-seq shows higher Wnt/β-catenin signaling in C3-HET as compared with C3-WT tumors (in CD45− cell population). NES, normalized enrichment score; FDR, false discovery rate; NOM, nominal. (B) Dot plot shows expression of key Wnt target genes across C3-WT and C3-HET tumor cells. Genes highlighted in red are Wnt signaling genes, including Wnt ligands. (C) List of Wnt ligands from bulk mRNA-seq (from NK cells) shows differential expression in NK cells sorted from C3-HET as compared with C3-WT tumors. (D) qRT-PCR analysis of Wnt target genes in primary tumor cells when cocultured with NK cells sorted from C3-HET as compared with C3-WT tumors in vitro. Relative expression is presented as fold change, and the dashed line represents the relative expression with respect to C3-WT. qRT-PCR values were normalized to Gapdh. Experiment was performed in technical duplicate. Each point represents a pool of five individual tumors. (E) The bar graph depicts the number of 4T1-derived tumorspheres after treatment with Wnt inhibitor (JW-74) and culture for 3 days with NK cells from C3-HET tumors. n = 2 independent experiments performed in technical triplicate. (F) Wnt reporter activity of EpRas-Top-dGFP (GFP+) upon coculture with NK cells from C3-HET tumors. (G) Wnt reporter activity of EpRas-7TGC (mCh+ GFP+) upon coculture with NK cells and EpRas tumor cells (right). mCh+ cells mark total infected cells with lentivirus (left). (H) Dot plot from scRNA-seq shows expression of selected Wnt ligands across four subpopulations of NK cells in C3-HET tumors. Statistical significance was determined by one-way ANOVA with Sidak’s multiple comparisons test in (E). All other data were analyzed using two-tailed Student’s t tests. The data are presented as means ± SEM.
