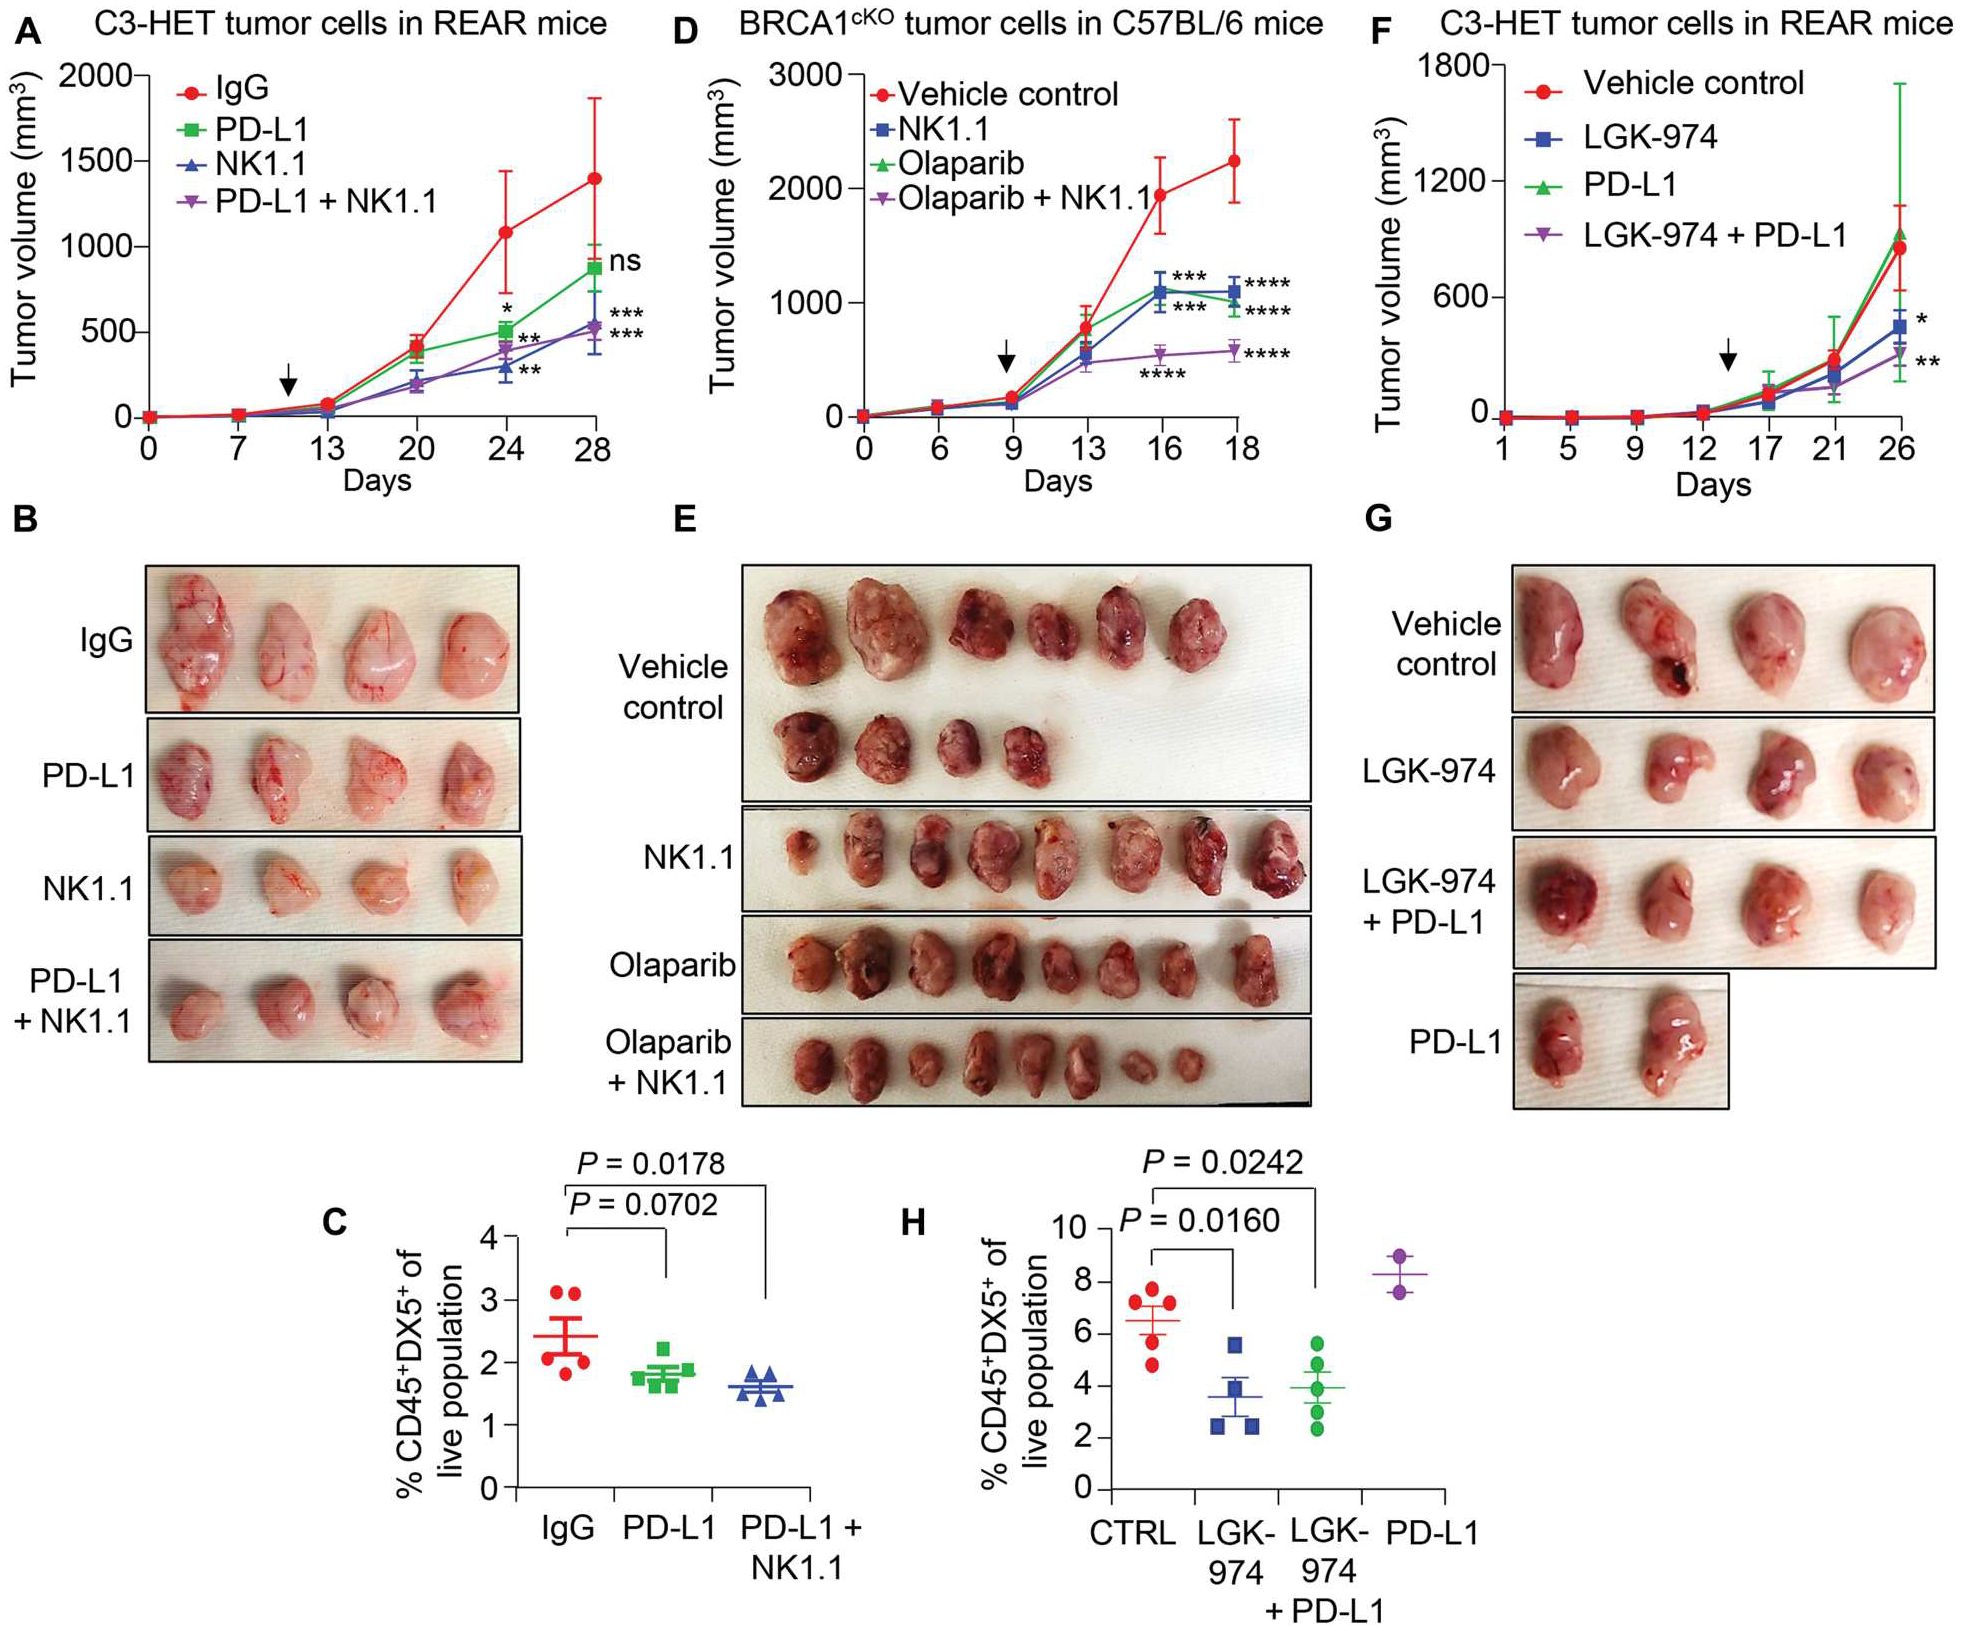
Fig. 7. Targeting NK cells or Wnt signaling improves the efficacy of immunotherapy or chemotherapy in murine TNBC models.

(A and B) Tumor growth curve (A) and representative tumor images (B) show tumor progression in anti-NK1.1 and anti-NK1.1 + anti–PD-L1 combination treatment groups (n = 8 tumors for IgG and n = 6 tumors for treated group). A total of 250,000 primary tumor cells per MFP from C3-HET tumors were injected into REAR mice. (C) Percentage of NK cell population (CD45+DX5+) of live cells in primary tumors of indicated groups. (D and E) Tumor growth curve (D) and representative tumor images (E) are shown for the indicated treatment group (n = 10 tumors for vehicle control and n = 8 tumors for treated group). A total of 150,000 primary tumor cells per MFP from BRCA1cKO tumors were injected into C57BL/6 mice. (F and G) Representative tumor images (F) and tumor growth curve (G) are shown for the indicated treatment group (n = 4 tumors for anti–PD-L1 and n = 6 tumors for the rest of the other groups). A total of 100,000 primary tumor cells per MFP from C3-HET mice were injected into REAR mice. Vehicle control and LGK-974 data points are shared with fig. S9F. (H) Flow cytometry analysis shows the NK cell frequency (CD45+DX5+) of live cells in C3-HET tumors. The scatterplots show the number per group of samples used for flow analysis. Statistical significance was determined by two-way ANOVA with Dunnett’s multiple comparisons test in (A), (D), and (F) and by one-way ANOVA with Dunnett’s multiple comparisons test in (C) and (H); *P < 0.05, **P < 0.01, ***P ≤ 0.001, and ****P ≤ 0.0001. The data are presented as means ± SEM. Arrows indicate the start point for drug dose. Anti-IgG (250 μg per mouse), anti-NK1.1 (250 μg per mouse), and anti–PD-L1 (250 μg per mouse) antibodies were given three times per week. An oral dose of LGK-974 (5 mg/kg of body weight) was given every alternate day, and olaparib (50 mg/kg of body weight) was given daily by intraperitoneal injection. ns, not significant.
