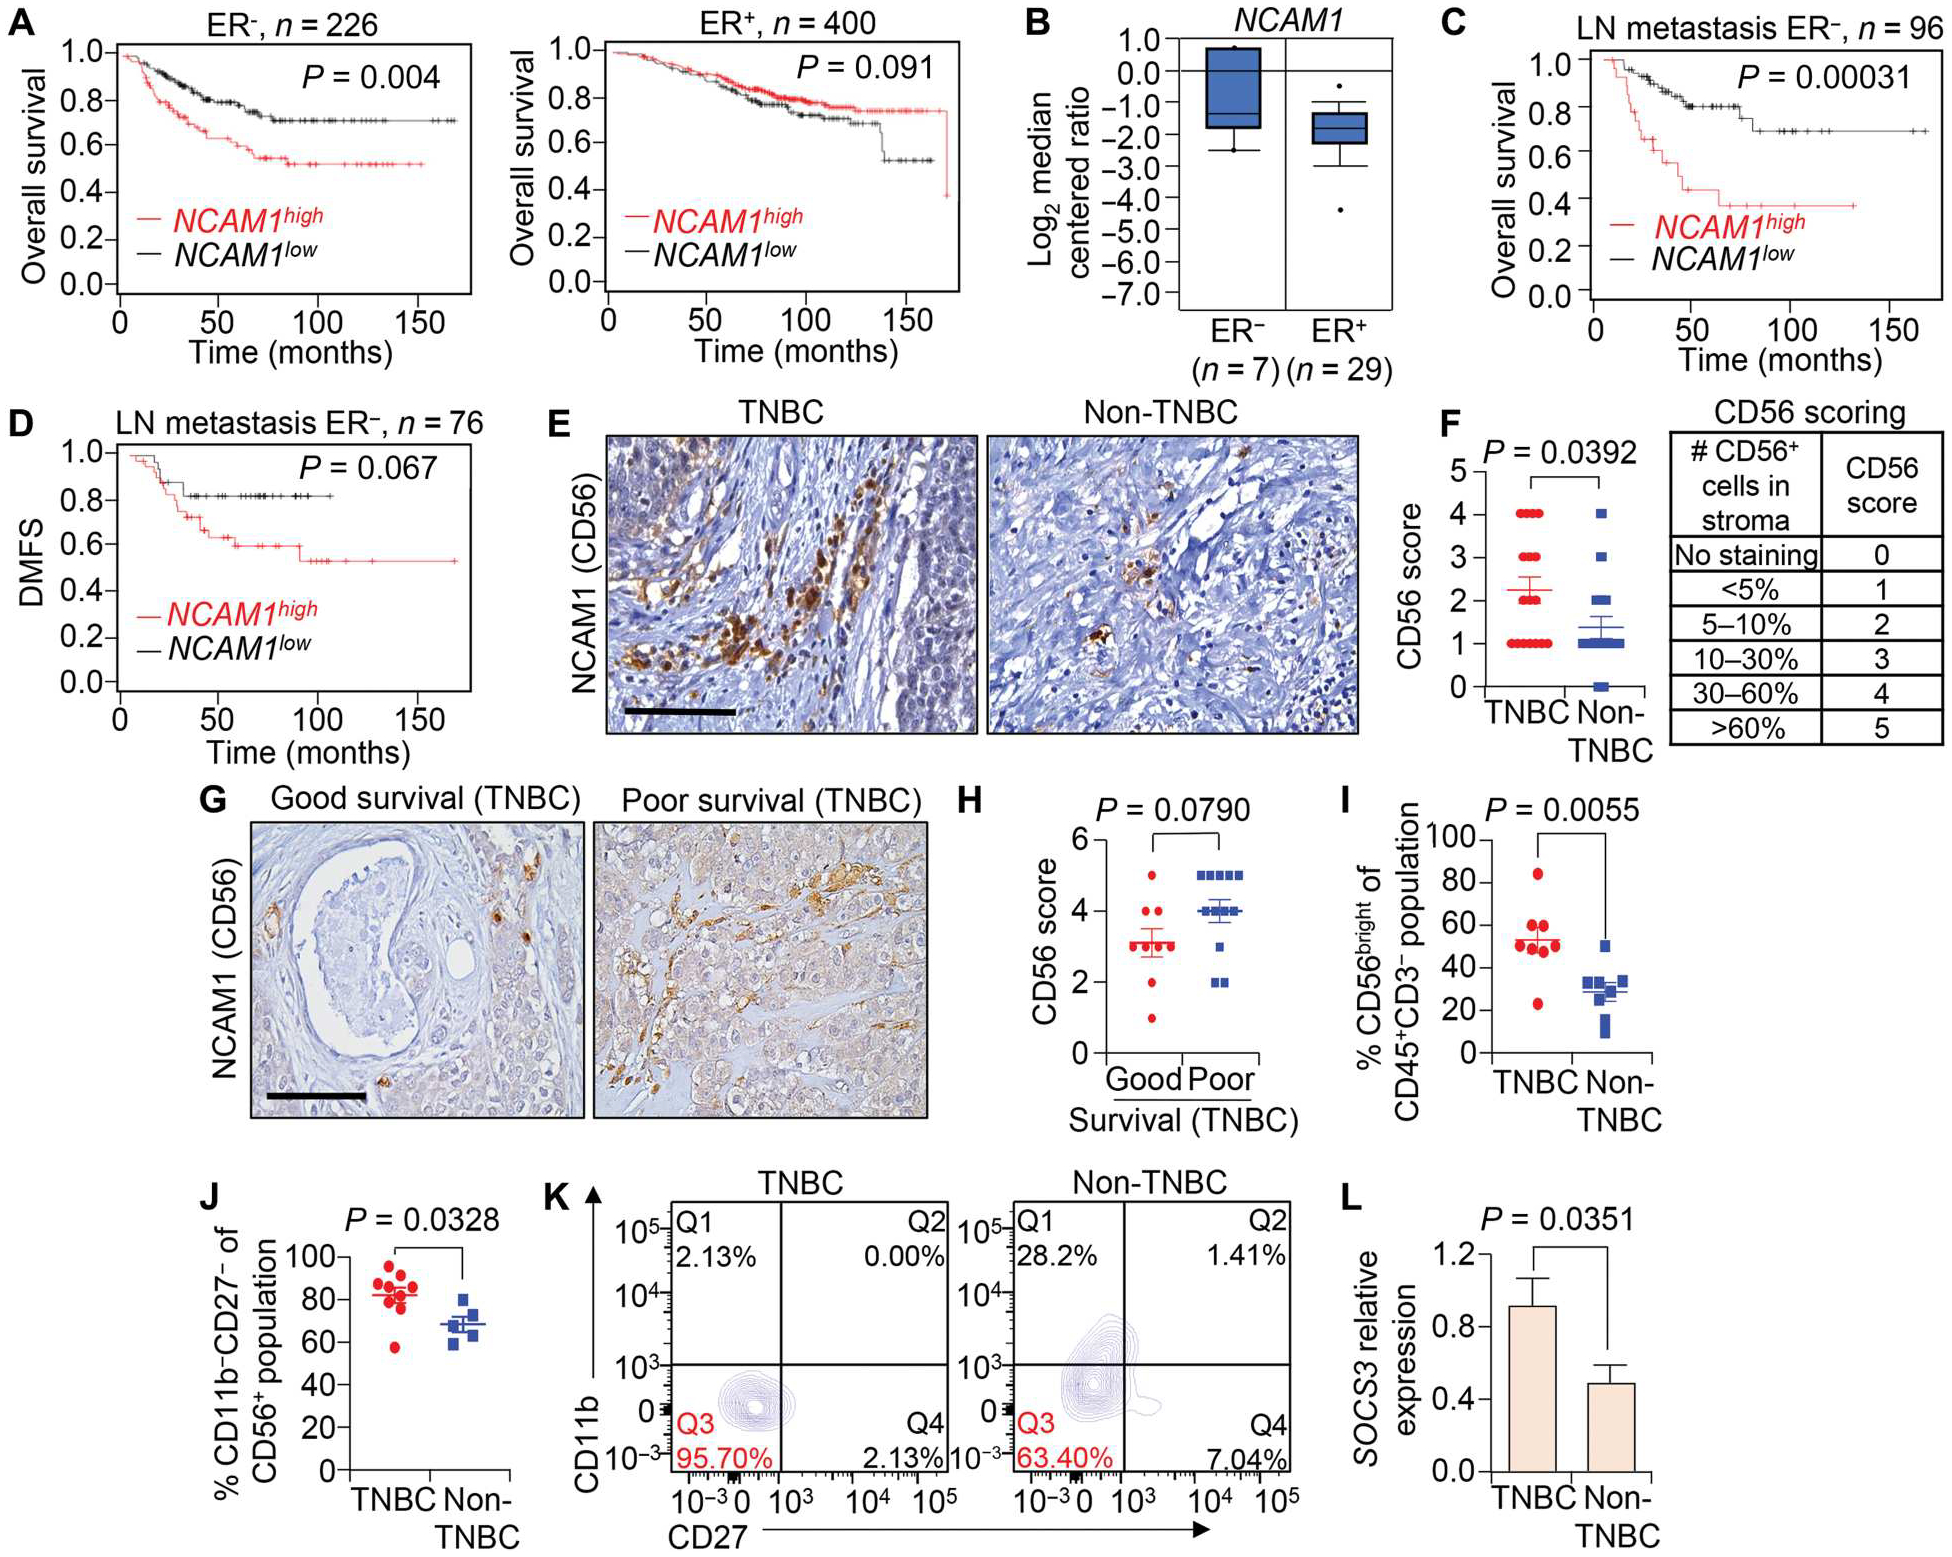
Fig. 8. NCAM1 expression is associated with reduced survival of patients with TNBC.

(A to D) The correlation between expression of NCAM1 (encoding CD56) and overall survival (OS) in patients with ER− (A) and ER+ tumors (B) as well as the correlation between expression of NCAM1 and overall survival (C) and distant metastasis–free survival (DMFS) (D) in patients with ER− tumors with lymph node metastasis. Data were analyzed using the KM plotter breast cancer database. (E and F) Representative IHC images (E) and quantification (F) are shown for CD56 expression in TNBC (n = 17) and non-TNBC (n = 16) tumor tissues. In all cases,“n” denotes independent biological samples. Quantification of CD56 scores was on a scale from 0 to 5 as indicated in (F). (G and H) Representative IHC images (G) and calculated CD56 scores (H) are shown for CD56bright cells in TNBC tissues stratified based on patient survival information (6 years cutoff value set to categorize poor versus good survival); n = 9 patient tumor tissues for good survival, and n = 12 for poor survival. (I) Scatterplot shows the percentage of the CD3−CD56bright NK cell population of the CD45+CD3− population in TNBC as compared with non-TNBC primary tumors. Fresh patient tumor tissues were used for analysis. (J and K) Scatterplot (J) and flow cytometry plots (K) show the percentage of CD56+CD11b−CD27− immature NK cells of the CD3−CD56+ population in TNBC as compared with non-TNBC primary tumors. Q3 represents immature NK cells. (L) qRT-PCR analysis shows relative mRNA expression of SOCS3 in NK cells from TNBC as compared with non-TNBC primary tumors. qRT-PCR values were normalized to Gapdh. The experiment was performed in technical duplicate (n = 3 individual tumors per group were used). Log-rank test was used for Kaplan-Meier plots to calculate P values in (A) to (D). Student’s t test was used to compute P values in (F), (I), (J), and (L), and Mann-Whitney U test was used for (H). The data are presented as means ± SEM. Scale bars, 100 μm.
