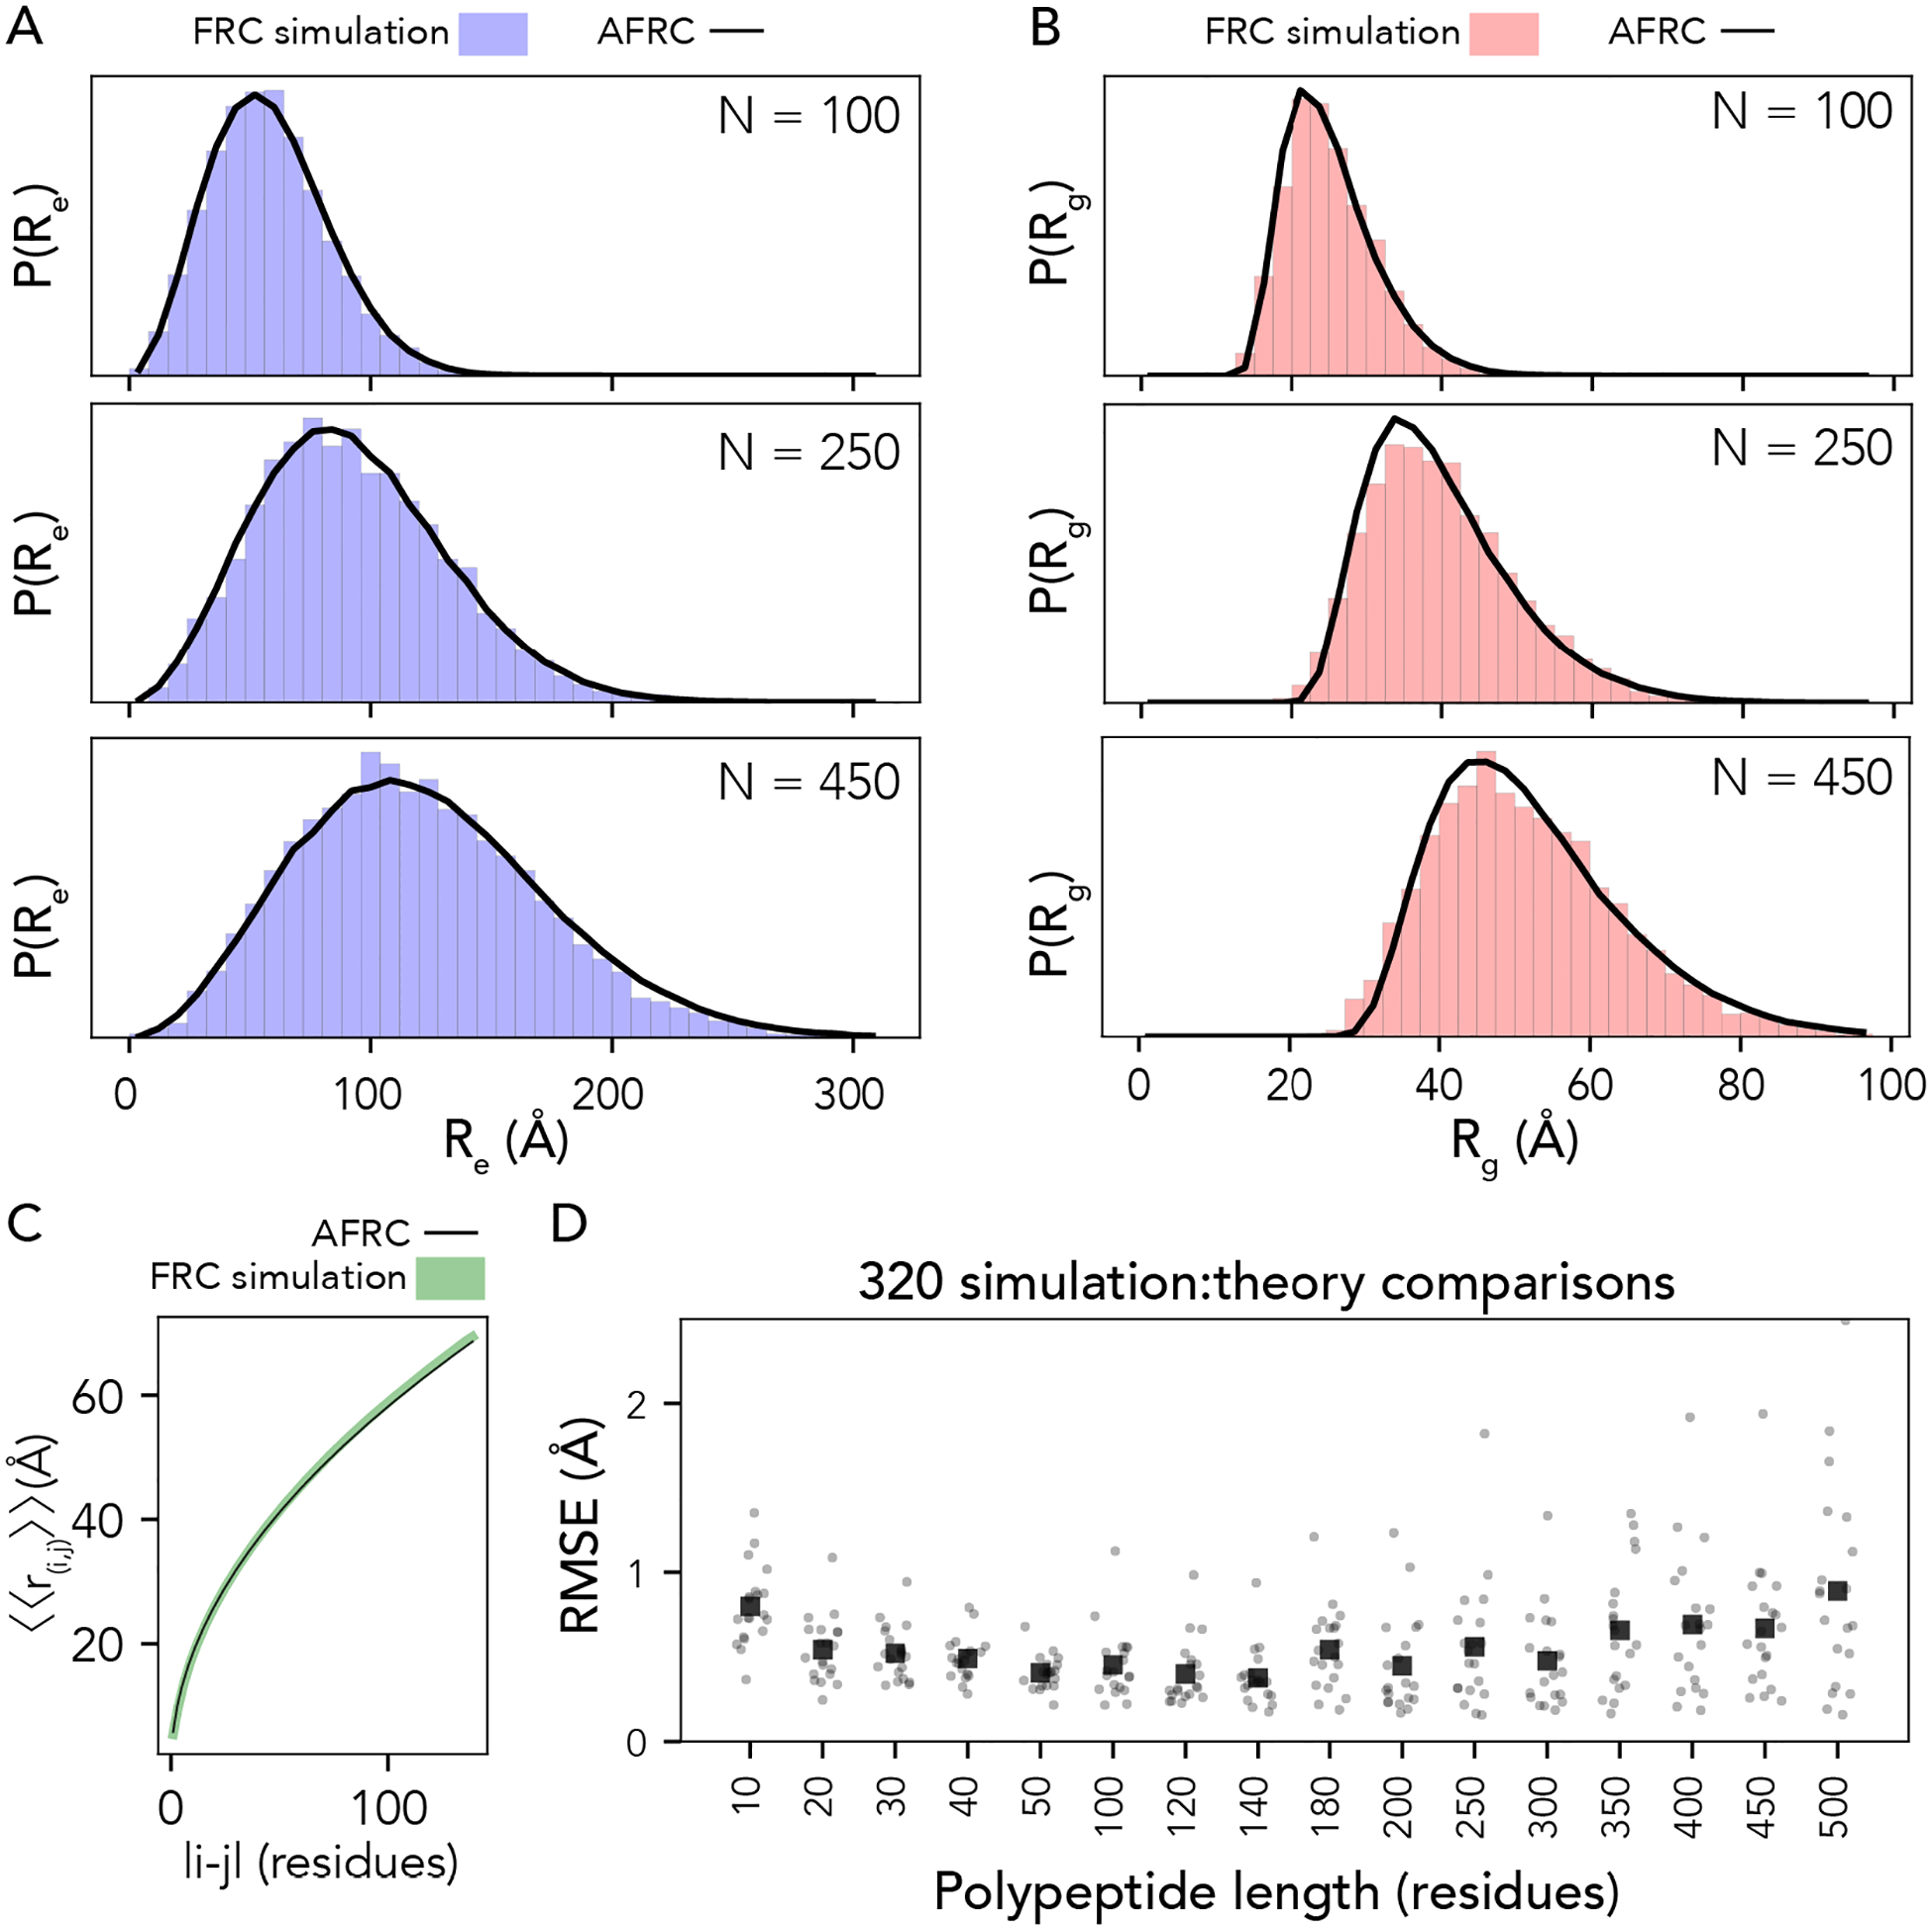
Fig. 3. The AFRC generalizes to arbitrary heteropolymeric sequences with the same precision and accuracy as it does for homopolymeric sequences.

A. Representative examples of randomly selected heteropolymers of lengths 100, 250, and 450, comparing the AFRC-derived end-to-end distance distribution (black curve) with the empirically-determined end-to-end distance histogram from FRC simulations (blue bars). B. The same three polymers, as shown in A, now compare the AFRC-derived radius of gyration distance distribution (black curve) with the empirically-determined radius of gyration histogram from FRC simulations (blue bars). C Comparison of AFRC vs. FRC simulation-derived internal scaling profiles for a 150-amino acid random heteropolymer. The deviation between FRC and AFRC for these profiles offers a measure of agreement across all length scales. D Comparison of root-mean-square error (RMSE) obtained from internal scaling profile comparisons (i.e., as shown in C) for 320 different heteropolymers straddling 10 to 500 amino acids in length. In all cases, the agreement with theory and simulations is excellent.
